
How Stephen Gould Scaled Its Capacity by 30% without Making a Single Hire
The Slingshot Blog
Get the latest trends in project management, team collaboration, data visualization and more. Here we share our knowledge, best advice, how-tos, research, insights, and more - all with the aim of helping you boost team results.
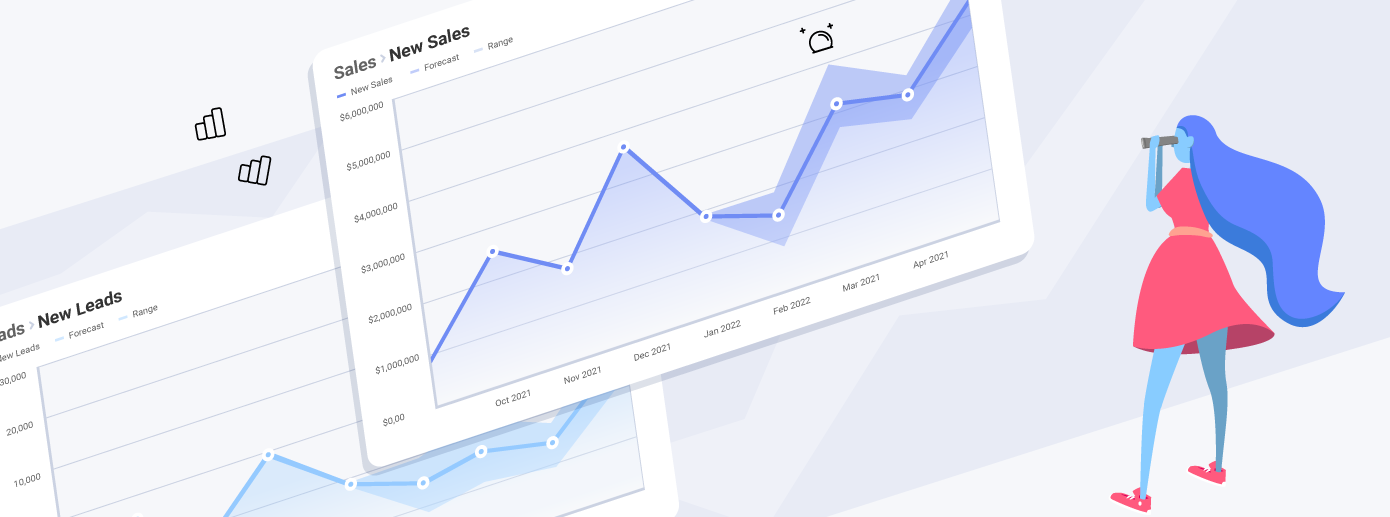
Predictive analytics is a type of data analysis that is used to predict events. In this blog, we explain how does it work, what are the main predictive analytics techniques, what are its benefits for businesses, and much more + examples.
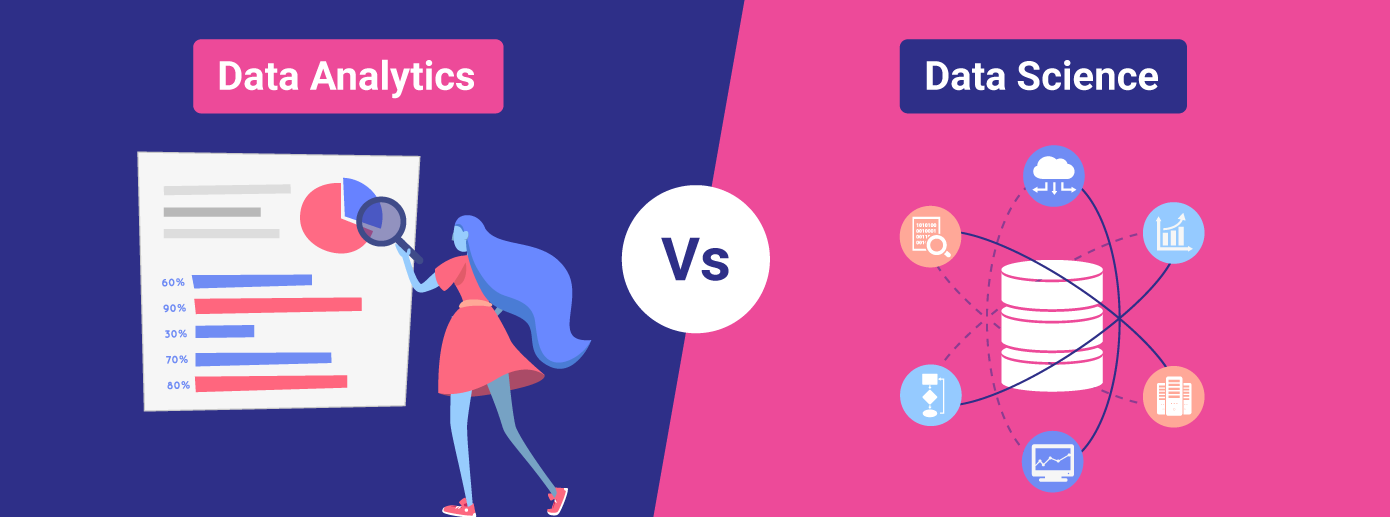
Data, data, data. It's taking over, and for good reason. Knowing and using data analytics and data science is now easy and it doesn't require much of a training anymore. How? Read on to find out.

Using R as a data analytics platform lets developers and data scientists create various types of visualizations to represent complex, raw data with minimum coding.
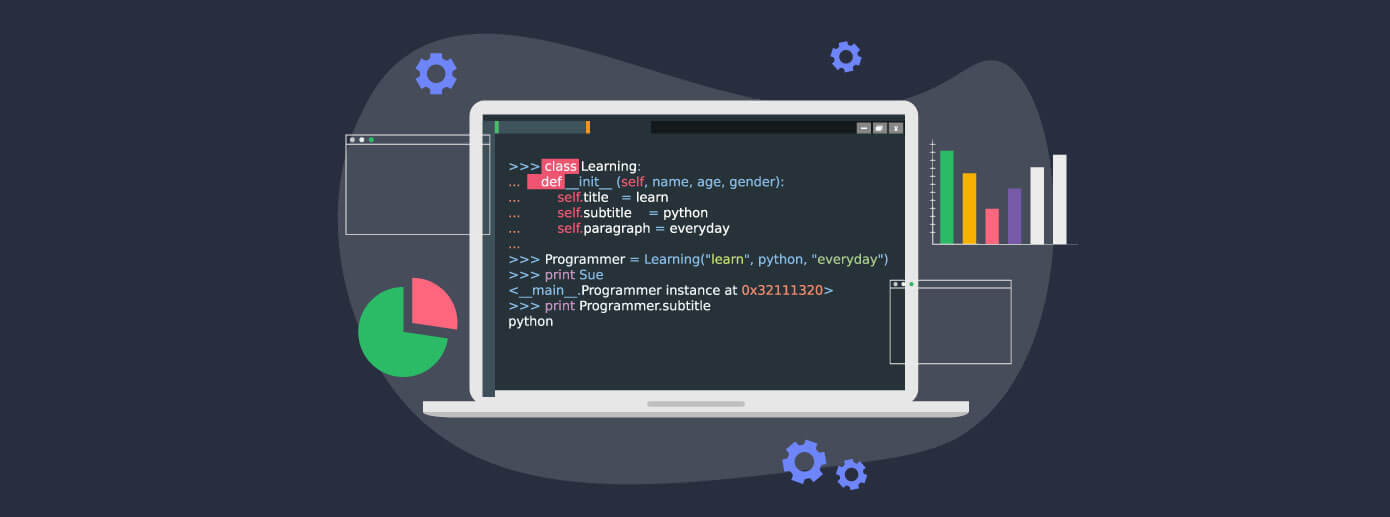
Using Python to create your data visualizations will help your users gain data insights in milliseconds compared to seconds or even minutes trying to analyze and understand large data sets of unformatted data represented in tabular formats
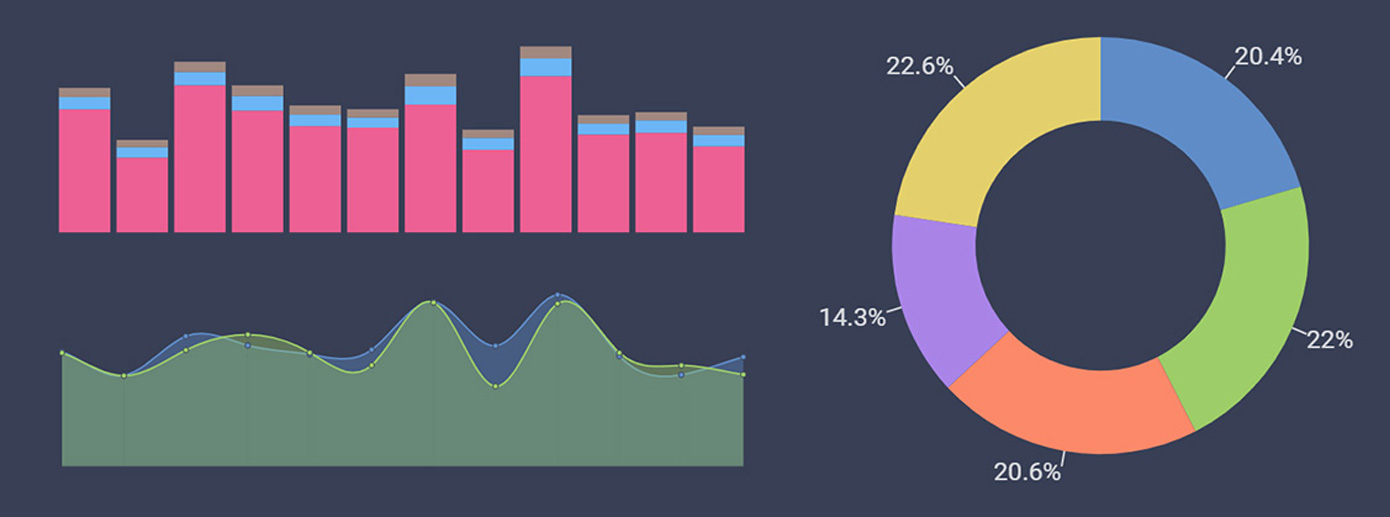
In this article, we make sure we show you the right steps to choose the best chart for your data, so your insights can always be used in the best way to get results.