Ad-Hoc Hierarchies
While Analytics creates hierarchies for Year-Month-Date date fields automatically, this does not happen for other types of fields. Ad-hoc hierarchies allow users to analyze the data in charts, gauges, and grid views, allowing users to create new hierarchies with the fields located in the Rows placeholder of the data editor.

This feature applies to plain data sources (for example, SQL tables, Excel spreadsheets or CSV files) and not to multidimensional data sources like Analysis Services. For those cases, the hierarchies are defined on the server side, and Analytics supports the expand and drill operations.
Note
Ad-hoc hierarchies are not supported in Text, Circular Image, Grid and Text View charts.
Enabling Ad-Hoc Hierarchies
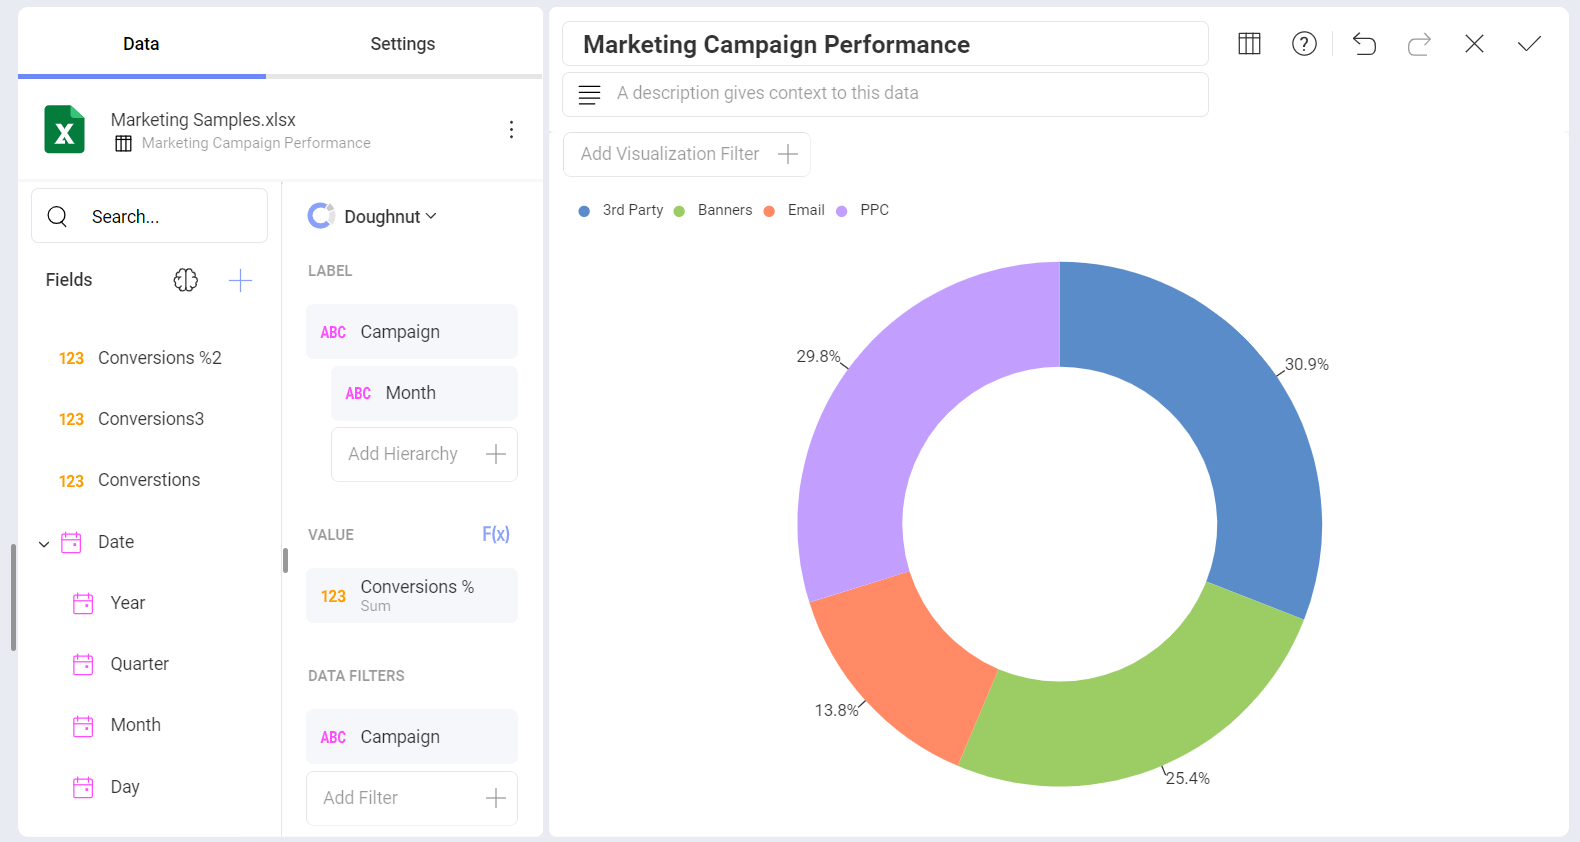
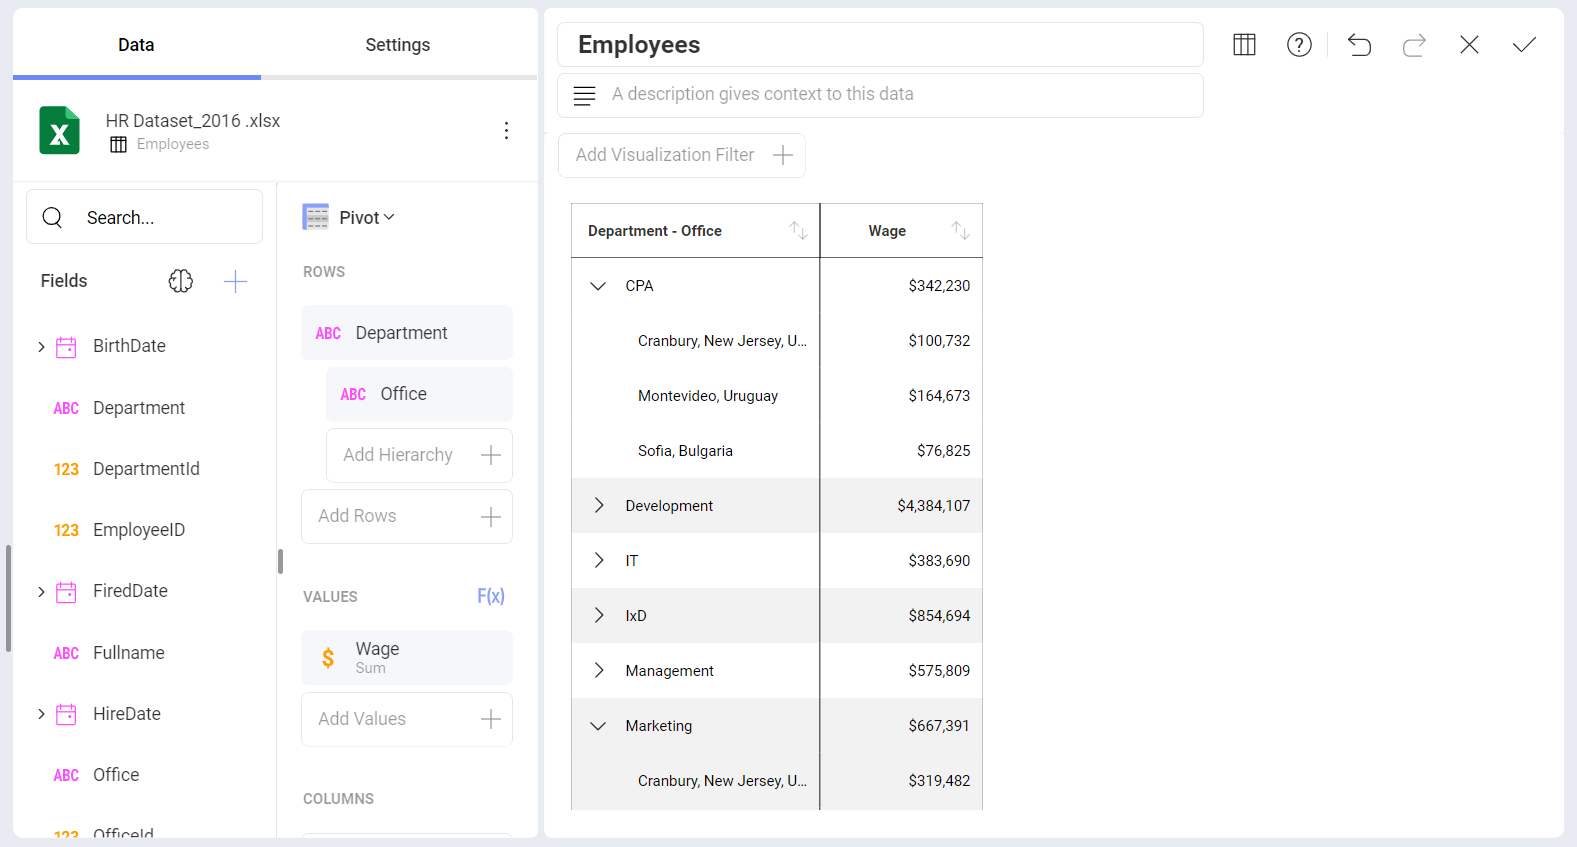
To enable ad-hoc hierarchies, just drag and drop a field in the Add Hierarchy section of the Rows placeholder in the data editor. When you do this, the structure and behavior of the data table will change.

As seen in the screenshot above, a single column will replace multiple columns. In the example presented in the screenshot, you not only can drill up and down, but you can also expand each Department to show the Office.
Supported Visualizations
Ad-hoc hierarchies can be added to all visualizations except for the following ones:
Circular Gauges
Grid Charts
Text Gauges
Text Views
Image Charts
