Text Box Visualization
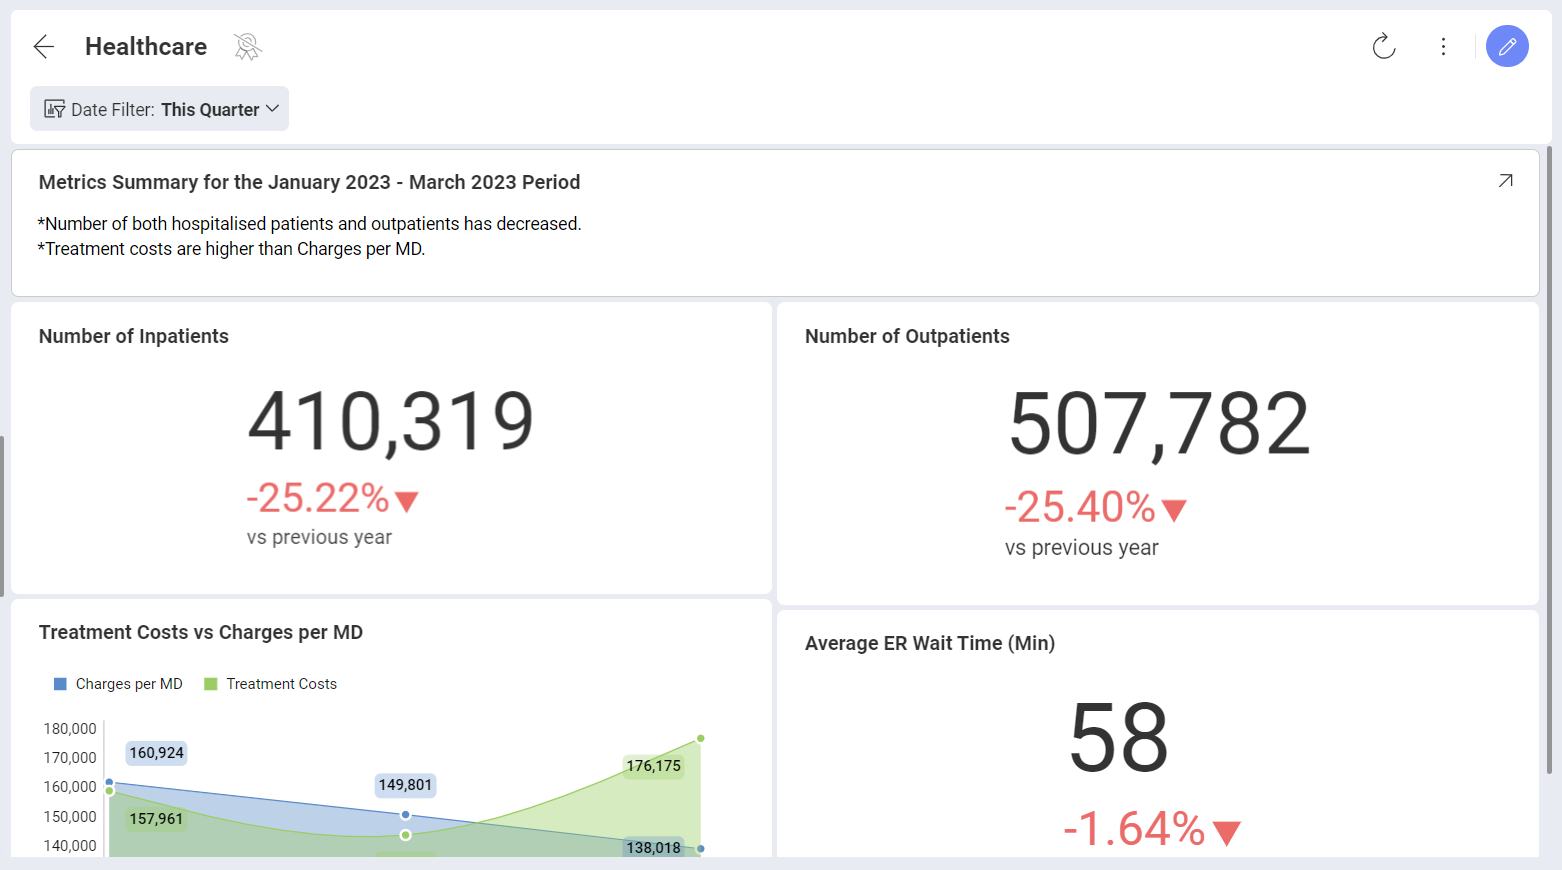
Text Box visualizations, as their name suggests, consist of a text body and an optional title. They are not connected to a data source. A common scenario for using a Text Box is adding a text summary to your report.
Adding a Text Box to Your Dashboard
To add a Text Box to an existing dashboard, you need to:
Open the dashboard in Edit mode.
Click/tap on the arrow on the right of the + Visualization split button and choose Text Box.
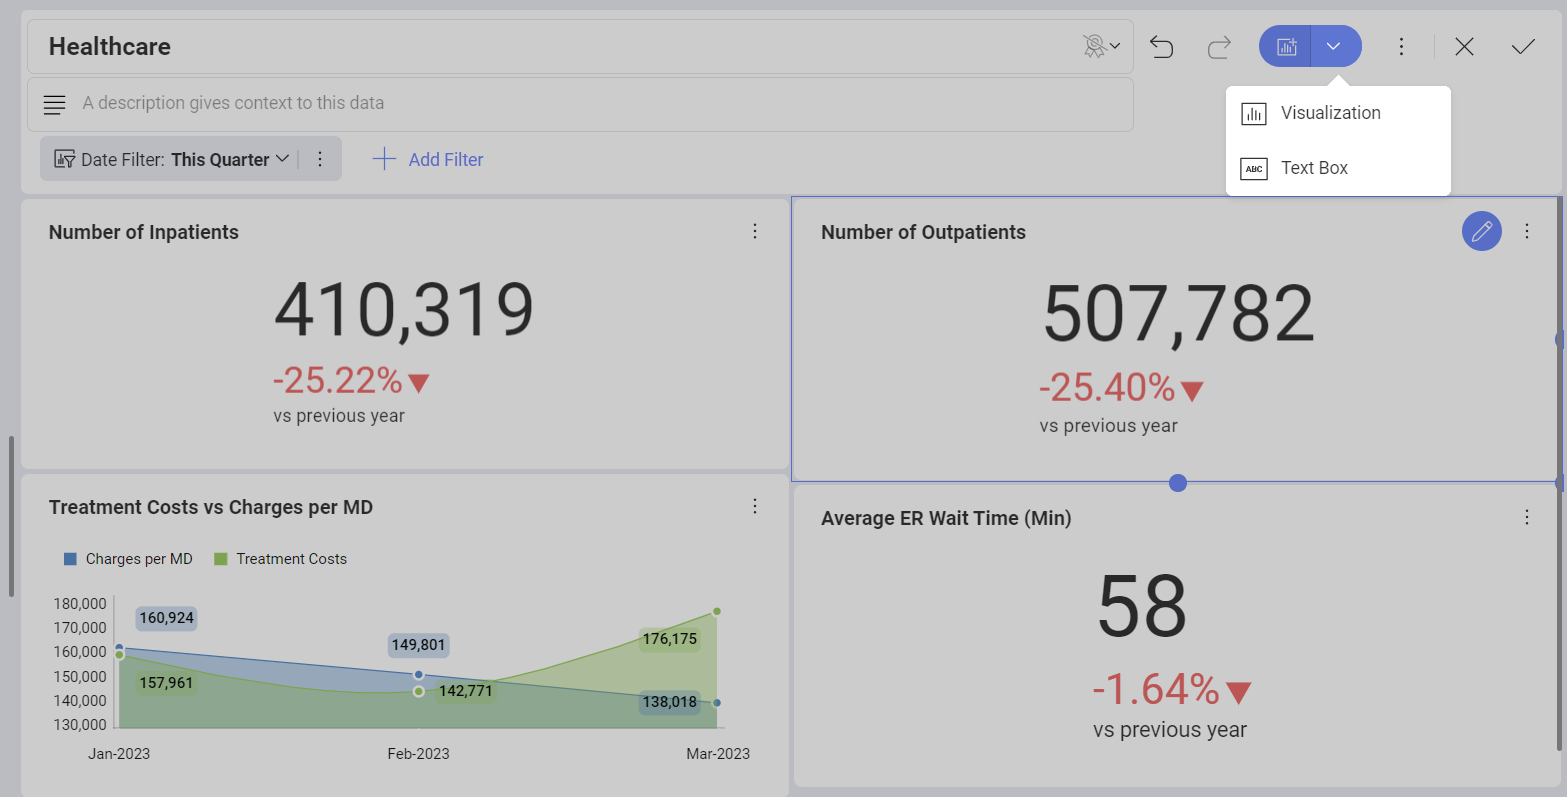
[!NOTE] When adding a Text box visualization to an existing dashboard, it appears at the bottom of your dashboard. You can move it by dragging it.
Creating a Text Box as a First Visualization in a Dashboard
Sometimes you may want to start your dashboard by creating a Text Box visualization, showing a summary or brief introduction. To access the Text Box creation menu, follow the steps below:
Click/tap on the + Dashboard button in the top right corner of the initial screen.
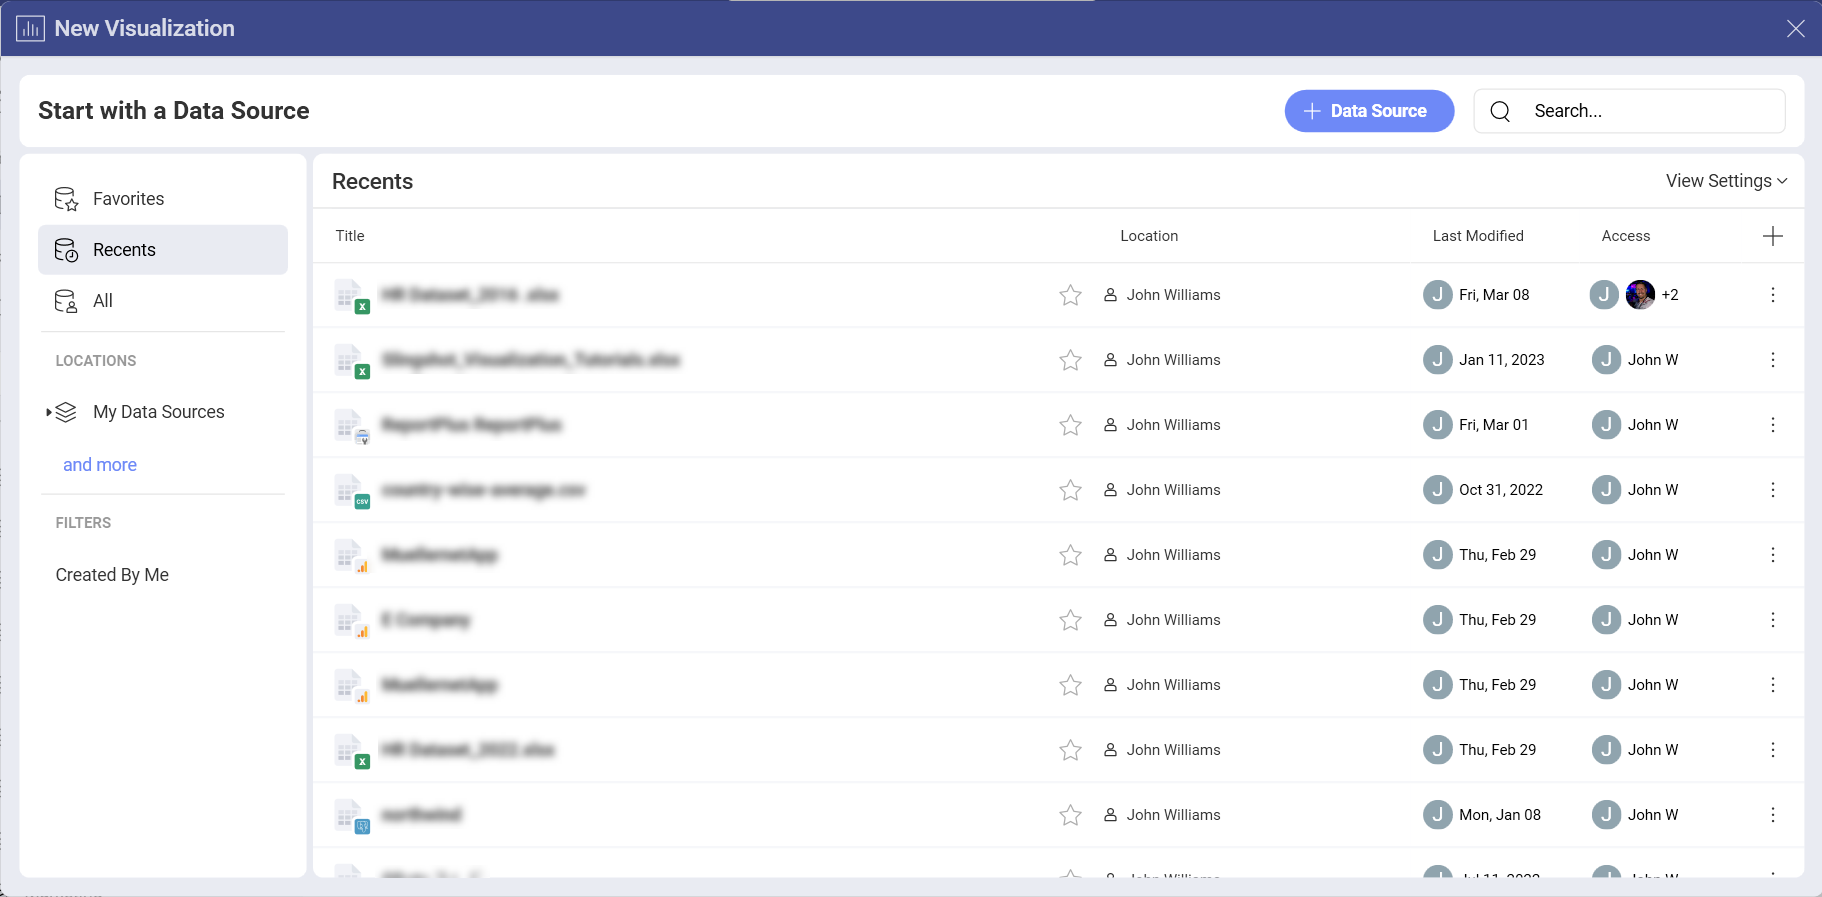
The New Visualization dialog opens and prompts you to select a data source. Click/tap on the X to close the dialog.
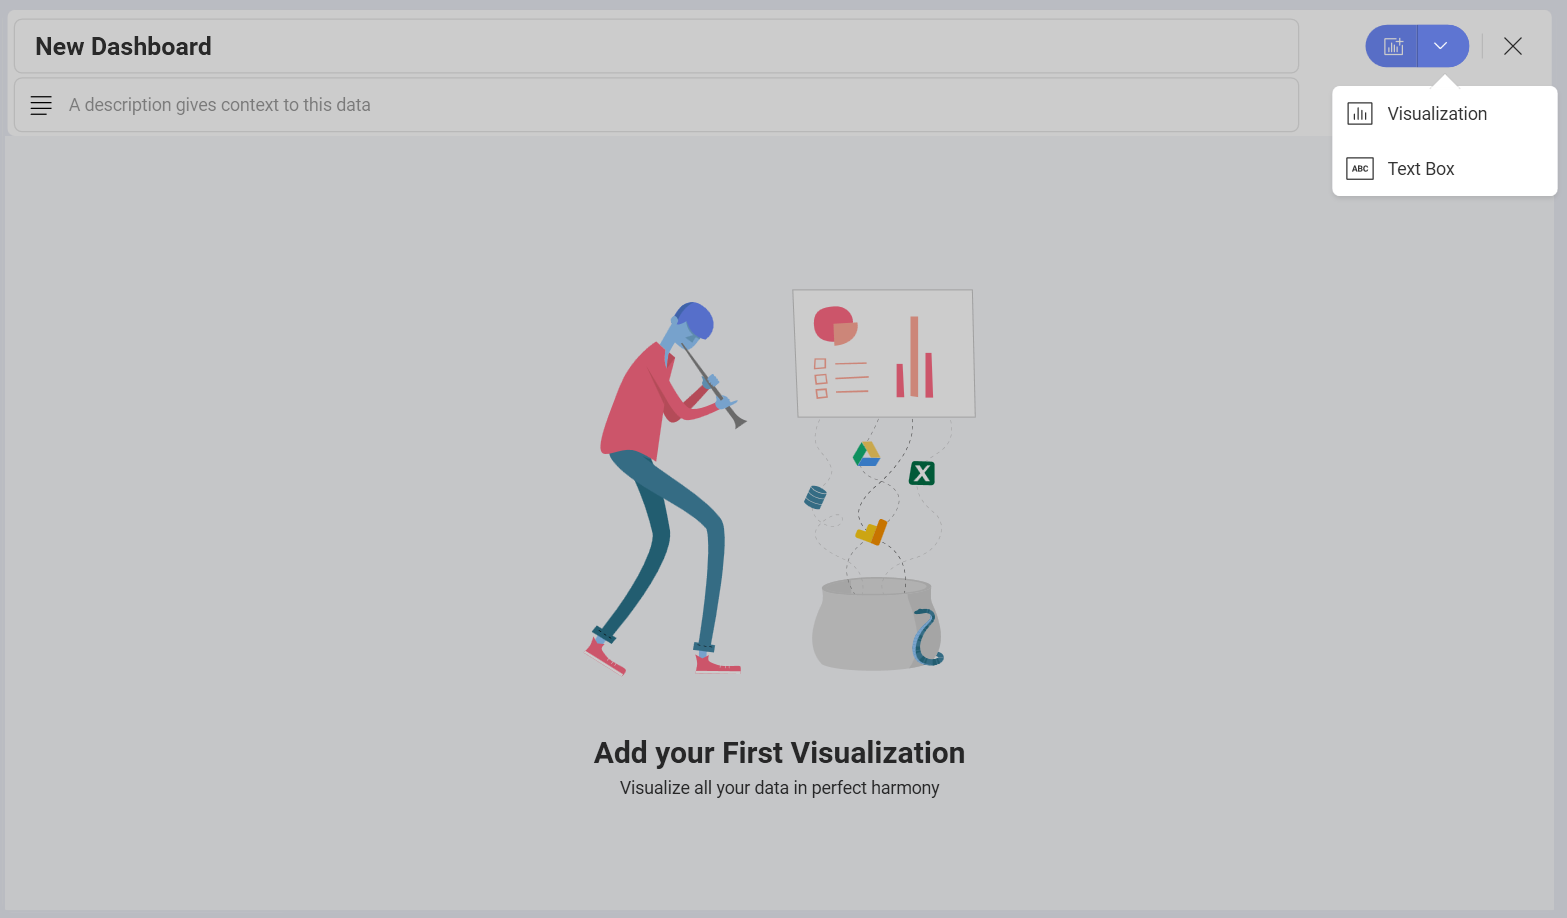
Click/tap on the arrow of the + Visualization split button and select Text Box.
Working With the Text Box Visualization
After choosing to add a new Text Box visualization, the following empty form appears:
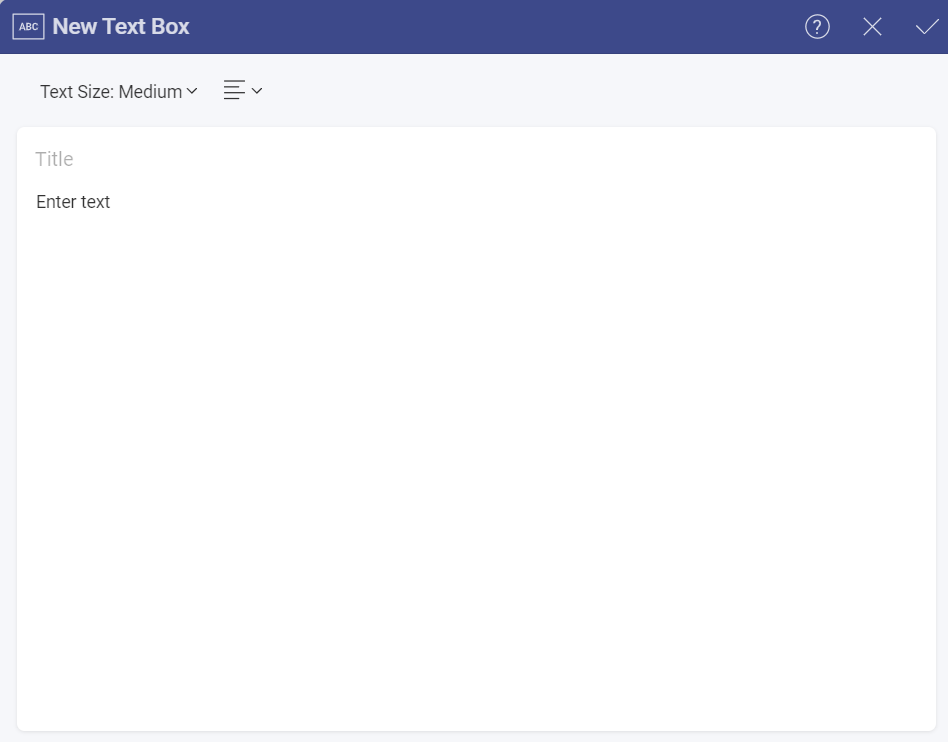
In this dialog you can:
Choose between Small, Medium and Large Text Size.
Select the alignment of the text (next to Text Size).
Write your own text in the text body (the Enter text box).
Add a Title. (optional)
