Microsoft Azure Synapse Analytics
The Microsoft Azure Synapse data source provides a significant speed increase when processing big data within Analytics. This allows you to use massive datasets for your visualizations with no slow down.
Configuring an Azure Synapse Analytics Data Source
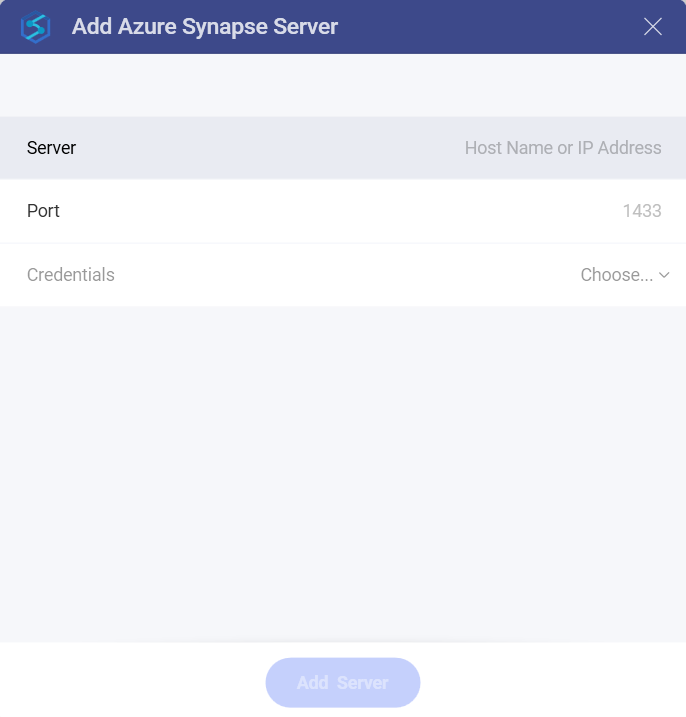
To configure a Microsoft Azure Synapse Analytics data source, you will need to enter the following information:

Server: the computer name or IP address assigned to the computer on which the server is running.
Port: if applicable, the server port details. If no information is entered, Analytics will connect to the port in the hint text (1433) by default.
Credentials: after selecting Credentials, you will be able to enter the credentials for your Microsoft Azure Synapse Analytics or select existing one if applicable.
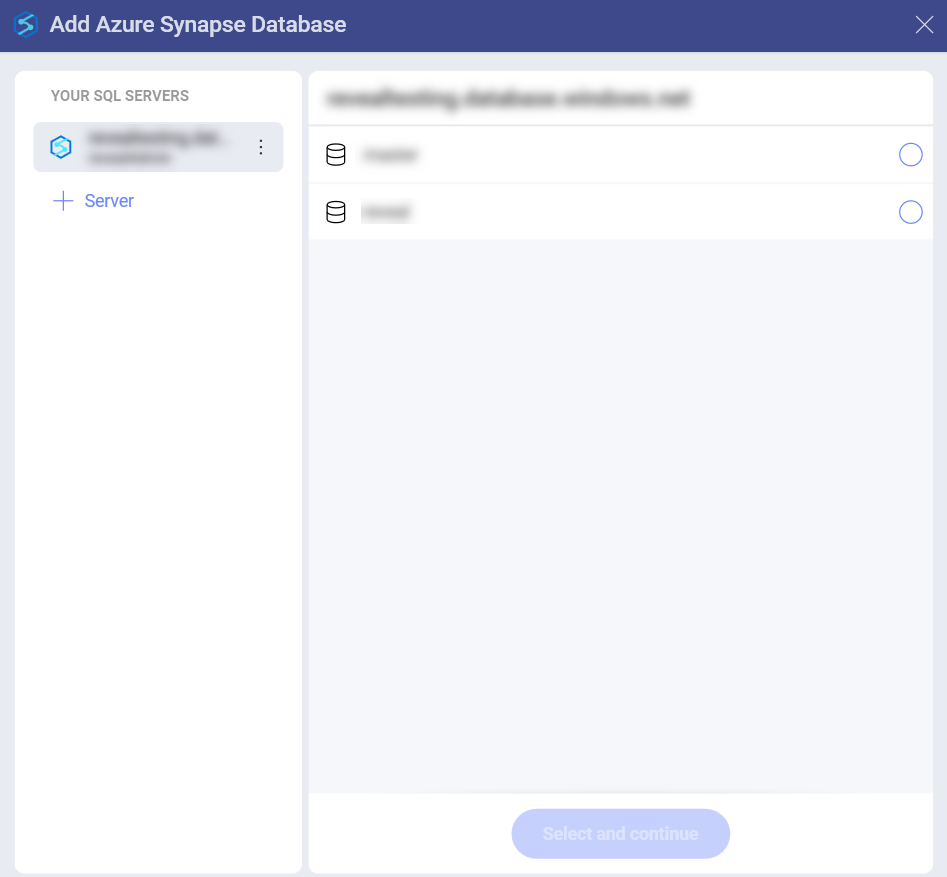
Database: Once you have connected to your account, you will get your databases to choose from. When you are ready, click/tap on Select and Continue.

How to find your Server Information
You can find your server by following the steps below. Please note that the commands should be executed on the server.
| WINDOWS | LINUX | MAC |
|---|---|---|
| 1. Open the File Explorer. | 1. Open a Terminal. | 1. Open System Preferences. |
| 2. Right Click on My Computer > Properties. | 2. Type in $hostname | 2. Navigate to the Sharing Section. |
| Your Hostname will appear as "Computer Name" under the Computer name, domain and workgroups settings section. | Your Hostname will appear along with your DNS domain name. Make sure you only include Hostname in Analytics. | Your Hostname will be listed under the "Computer Name" field on top. |
You can find your IP address by following the steps below. Please note that the commands should be executed on the server.
| WINDOWS | LINUX | MAC |
|---|---|---|
| 1. Open a Command Prompt. | 1. Open a Terminal. | 1. Launch your Network app. |
| 2. Type in ipconfig | 2. Type in $ /bin/ifconfig | 2. Select your connection. |
| IPv4 Address is your IP address. | Inet addr is your IP address. | The IP Address field will have the necessary information. |
Setting Up Your Data
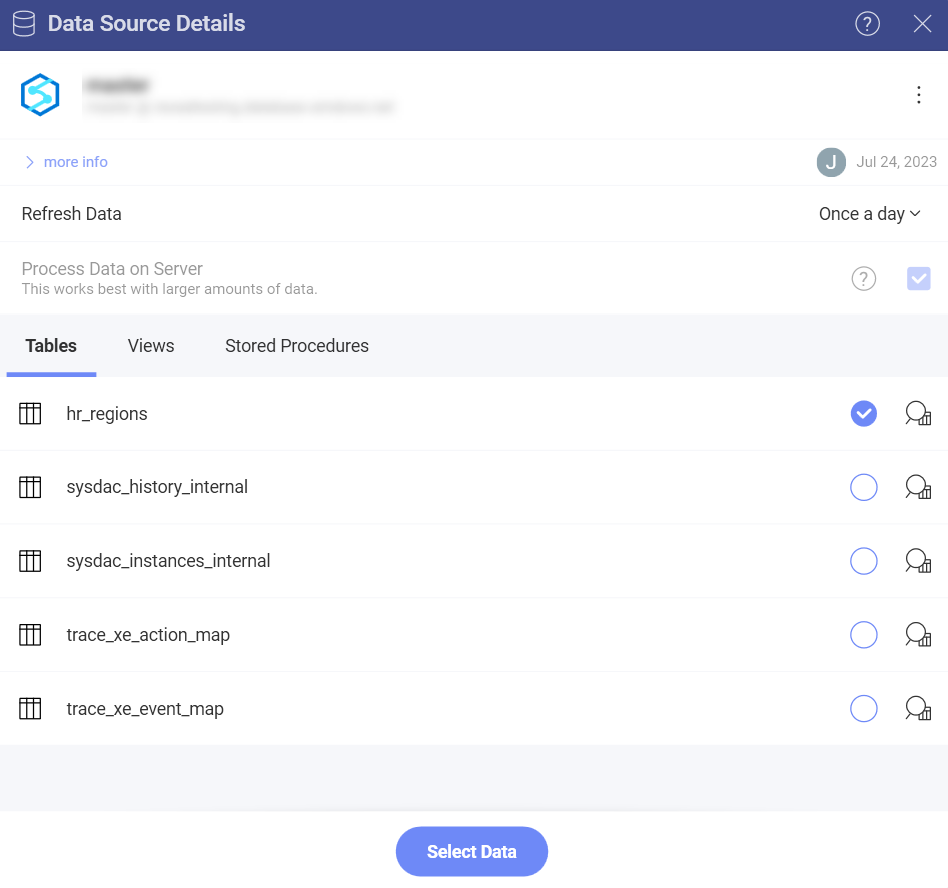
Once you connect to a database in MS Azure Synapse Analytics, you can choose to retrieve data from an entire table, a particular view or stored procedure.

Working with tables, views and stored procedures when using Azure Synapse Analytics closely resembles working with data from MS SQL Server. For more information, please refer to this section of the MS SQL Server data source topic.
Working in the Visualization Editor
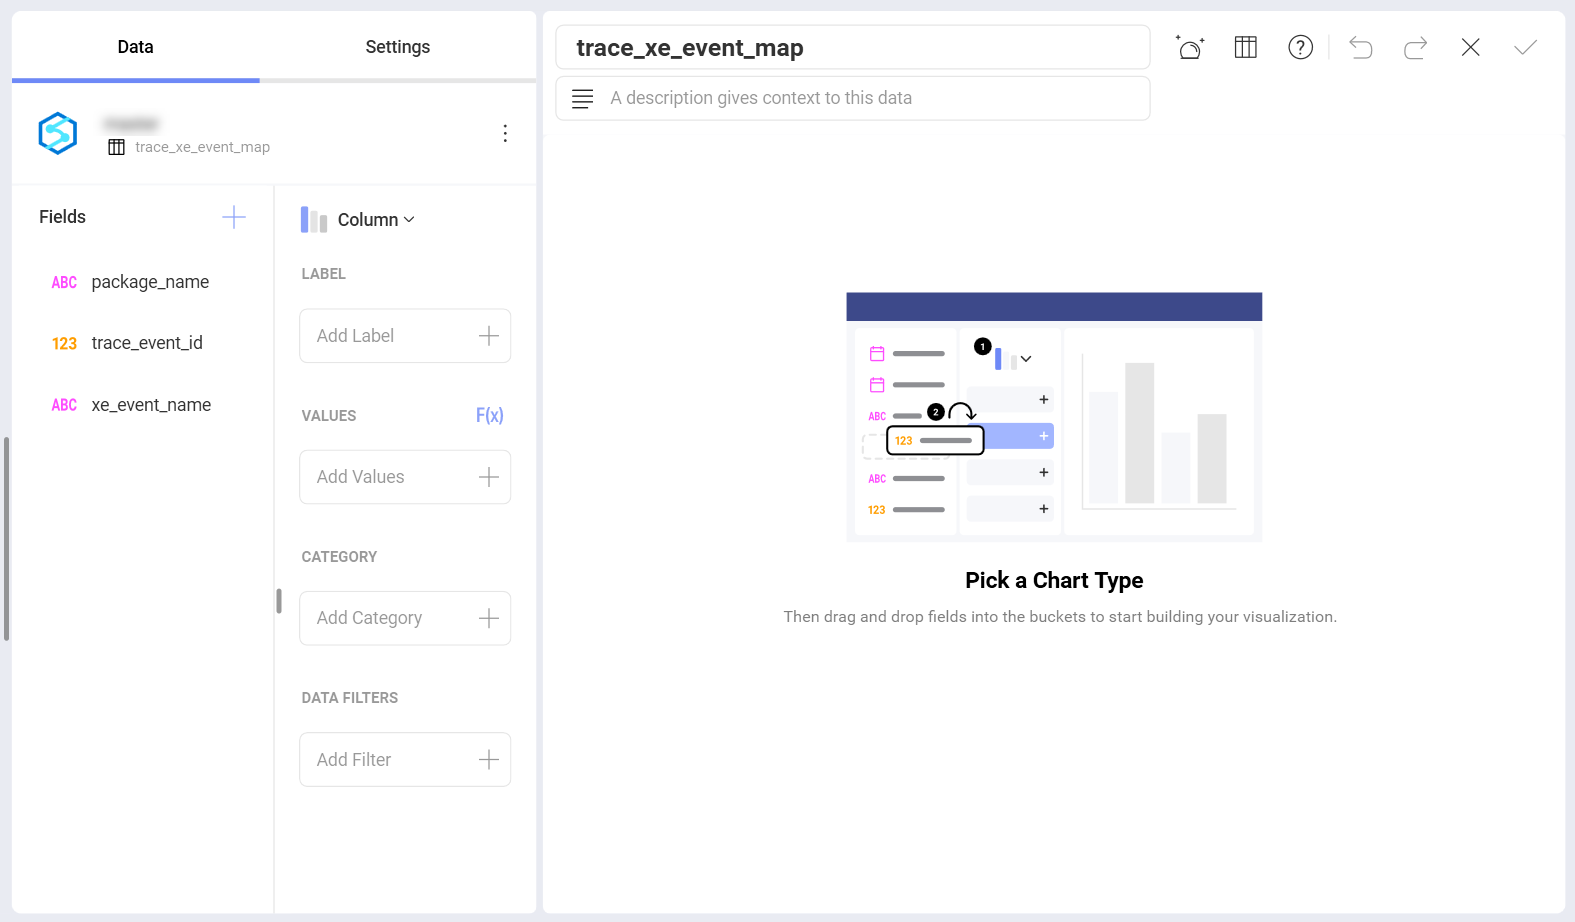
Once your data source has been added, you will be taken to the Visualization Editor. Here you can build your dashboard.
Keep in mind that the Column visualization will be selected by default. You can click/tap on it in order to choose another chart type.

Limitations in the Visualization Editor
When working with big data in Analytics, there are a couple of limitations in the Visualization Editor due to the specific approach used to handle data sources storing millions of records.
Limitations in Functions Available for Calculated Fields
Currently, only a limited number of functions are available for Calculated Fields using data from Azure Synapse Analytics:
Date - day; month; year; quarter;monthname; applytimezone; currenttimezone.
Logic - false; true; if; not.
Math - abs; log; log10; sign; sqrt.
Strings - find; len; trim; lower; mid; upper.
Limitations in Data Blending
Currently, Data Blending (combining data sources in one visualization) is not available when using data from the Azure Synapse Analytics data source.
