
How Stephen Gould Scaled Its Capacity by 30% without Making a Single Hire

Slingshot makes it easy to work with your Excel and Google Sheet files in many different ways.
From tracking your budget, your customers’ journeys from start to finish to sort data and calculation, Excel and Google Sheets are two of the most broadly used applications. But when it comes to data analytics these tools are not so powerful.
Slingshot makes it easy to work with your Excel and Google Sheet files in many different ways.
Slingshot was built on top of Google and Microsoft, making it a natural integration with your cloud storage, contacts, and permissions.
Once you are connected to all the cloud providers that you use in your workflow, your documents became available to you at all times.
You can then work smoothly with all these documents – pin them to boards, attach them to tasks for further help, chat and collaborate around them – we made all this possible for you so you can make the most out of your key content and be able to use it at the point of impact.
Boards are a great way to organize the chaos of your current content solutions. When you can bring all of the files and URLs that your teams and projects need into one contextual place it makes finding information so much easier – productivity increases and time doesn’t go to waste.
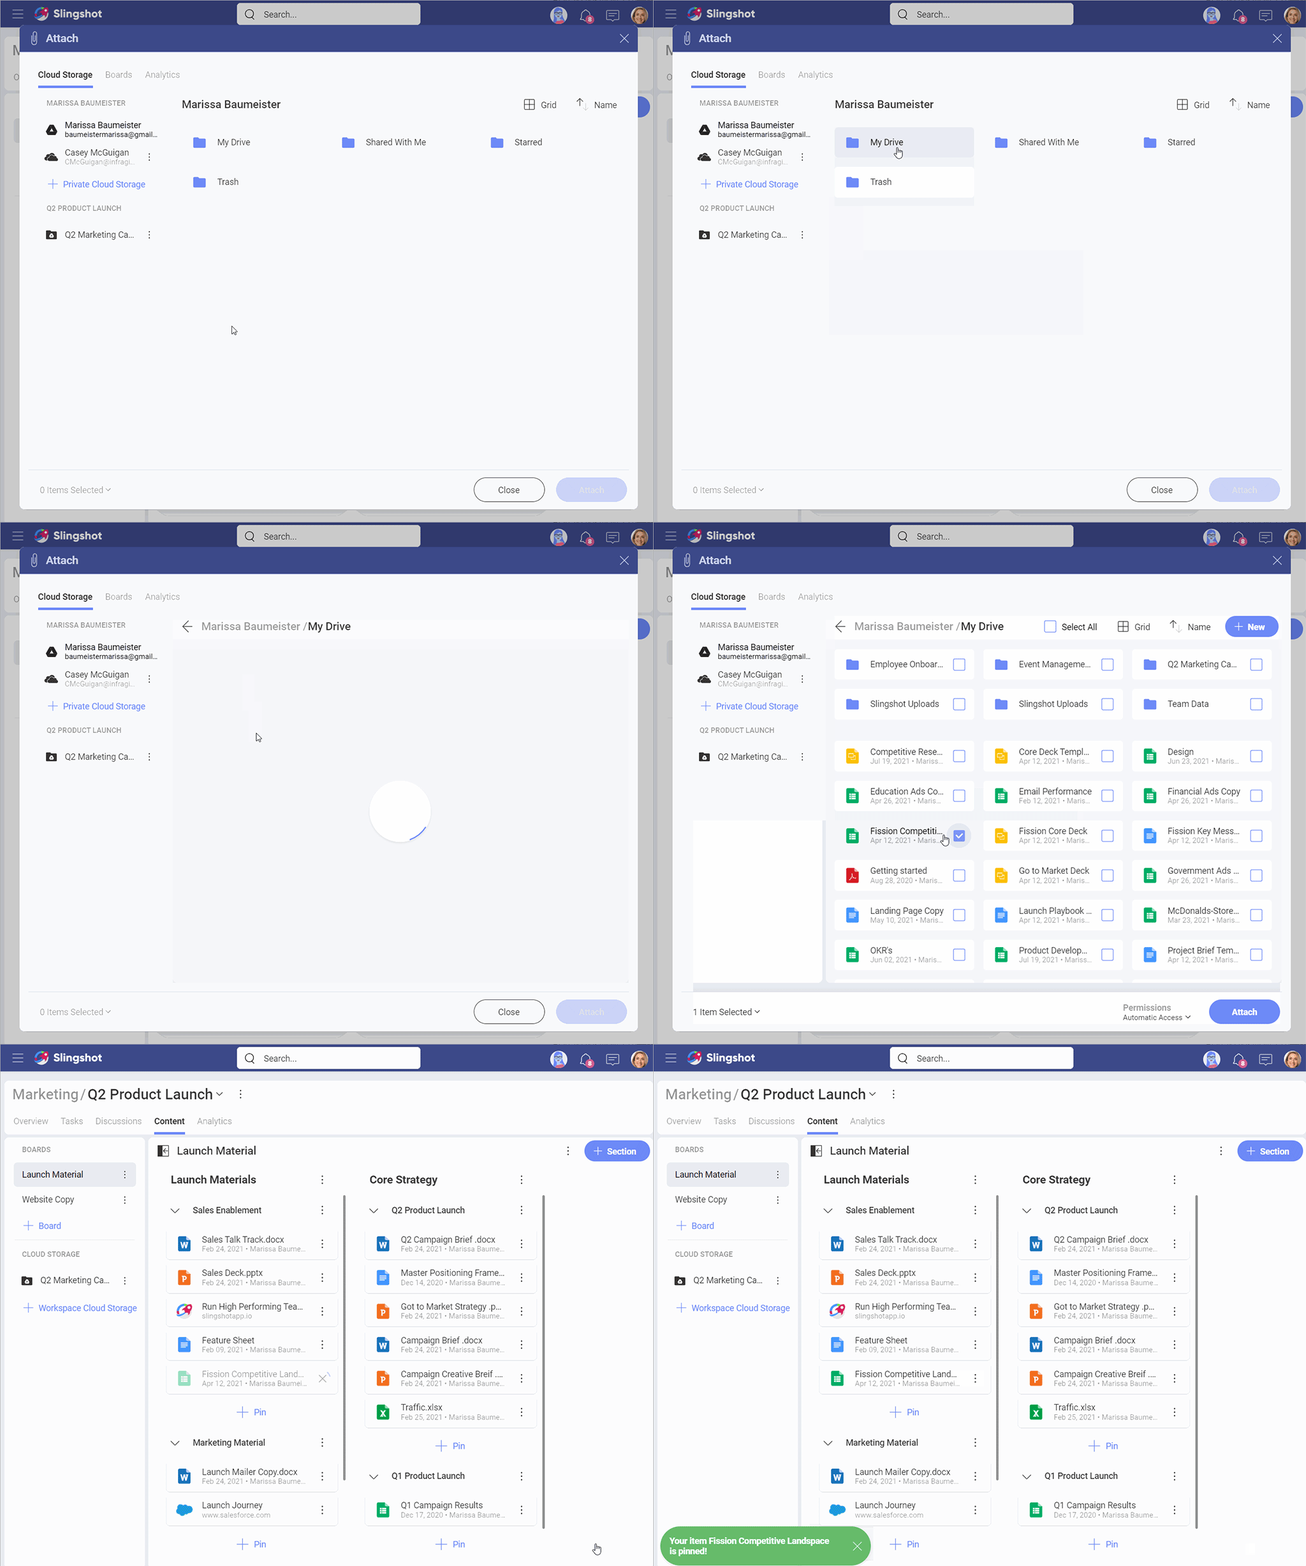
The same goes for conversations within the chat and the discussion areas. So many topics and questions come up on the fly. You need a quick and easy way to share files back and forth. From the attachment icon, you can promptly access all of your Excel and Google Sheets readily available.
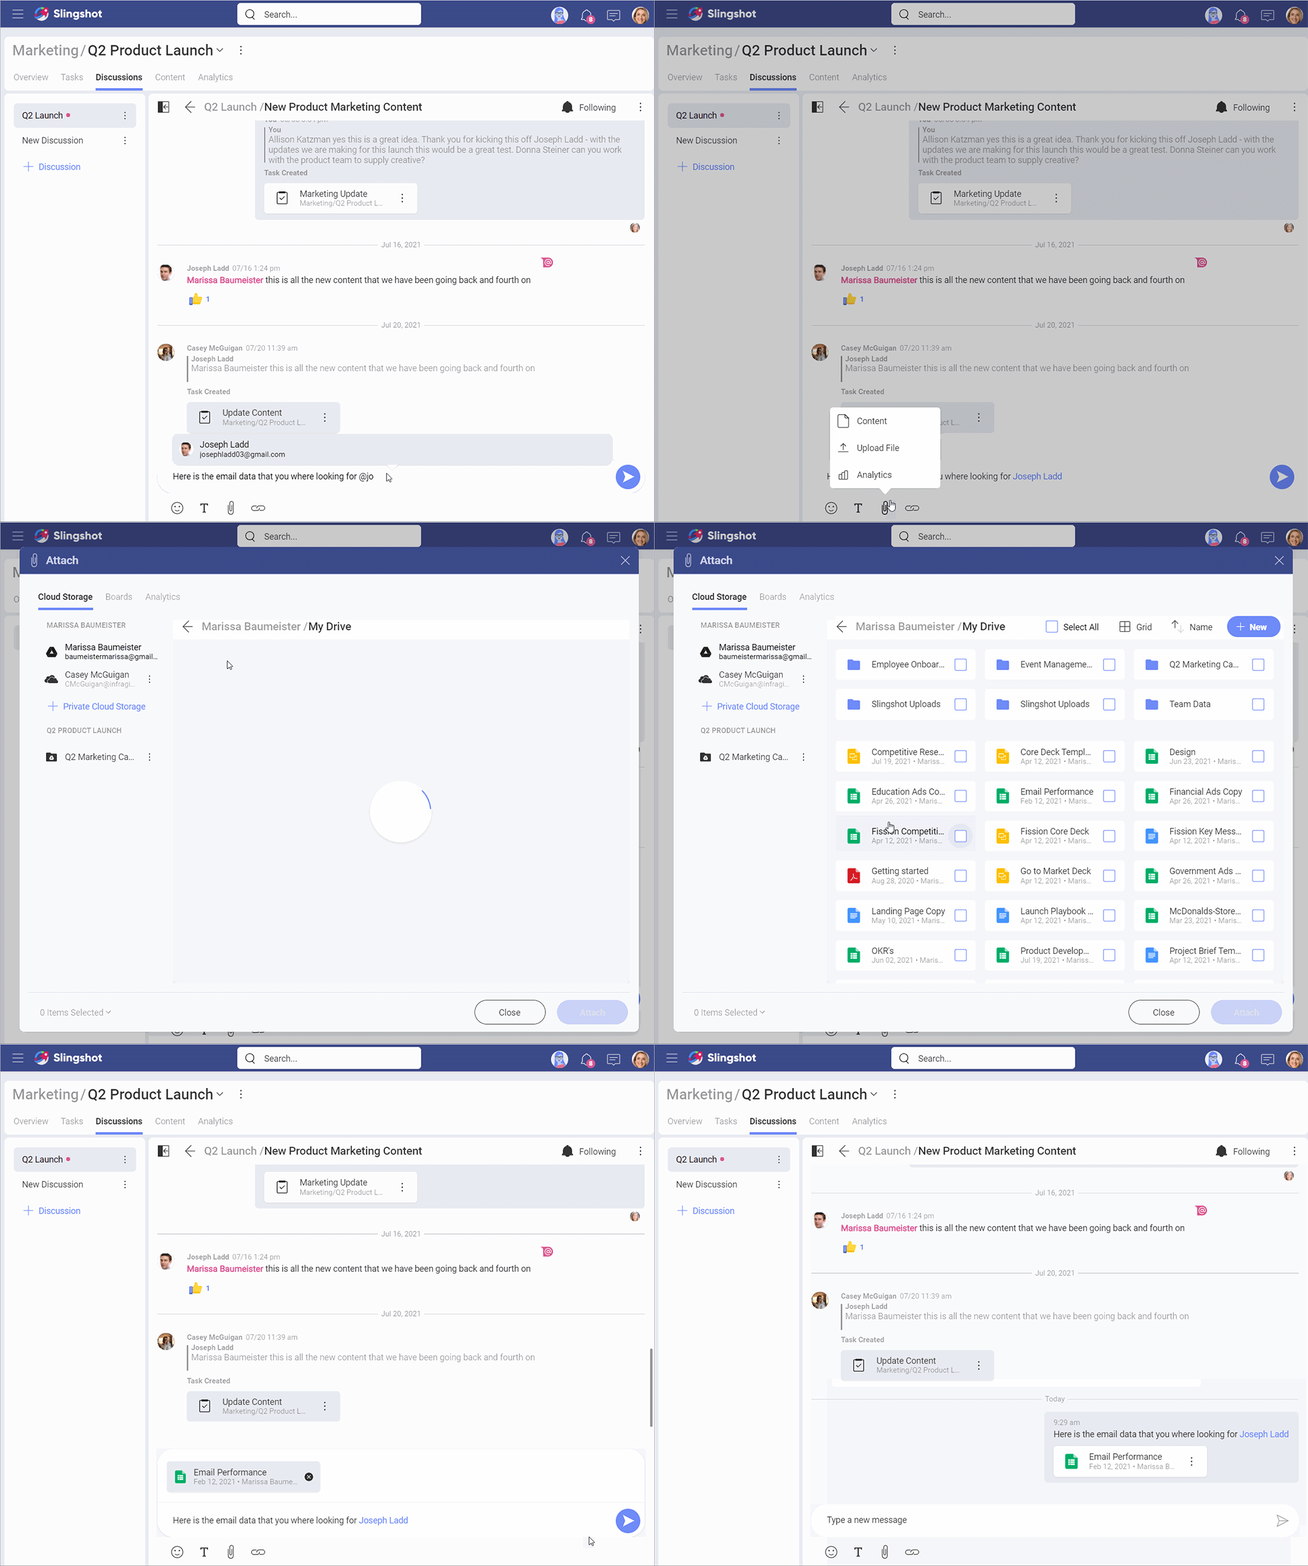
Spreadsheets are today’s most popular way to maintain business data, analysis, and more. However, as businesses continue to rely on data to grow, the importance of data visualizations will grow respectively. To extract actionable insights from data, you need visualization techniques such as charts and graphs rather than the traditional, but outdated spreadsheets data reports. Visualization tools like graphs, tables, maps, and others help understanding data faster and easier and speed up the decision-making process.
Visual representations of data can’t always stand alone, however. To unlock data’s full potential, you need to turn data into actions that fit into your daily workflow.
Slingshot comes packed with an entire business intelligence machine built inside that allows you to do just that. It allows you to quickly create beautiful dashboards in minutes right from your Excel files.
Follow these 5 steps to build your first dashboard from Excel:
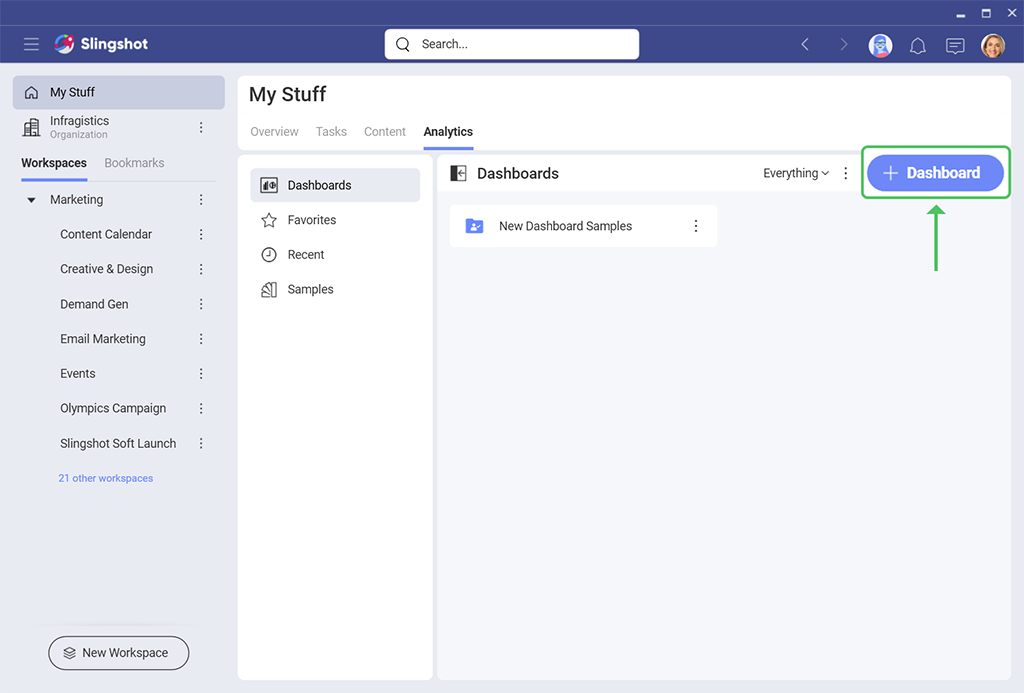
1.Go to the Analytics tab of the Workspace in which you want to create the dashboard and click the +Dashboard button in the upper right corner of your screen.
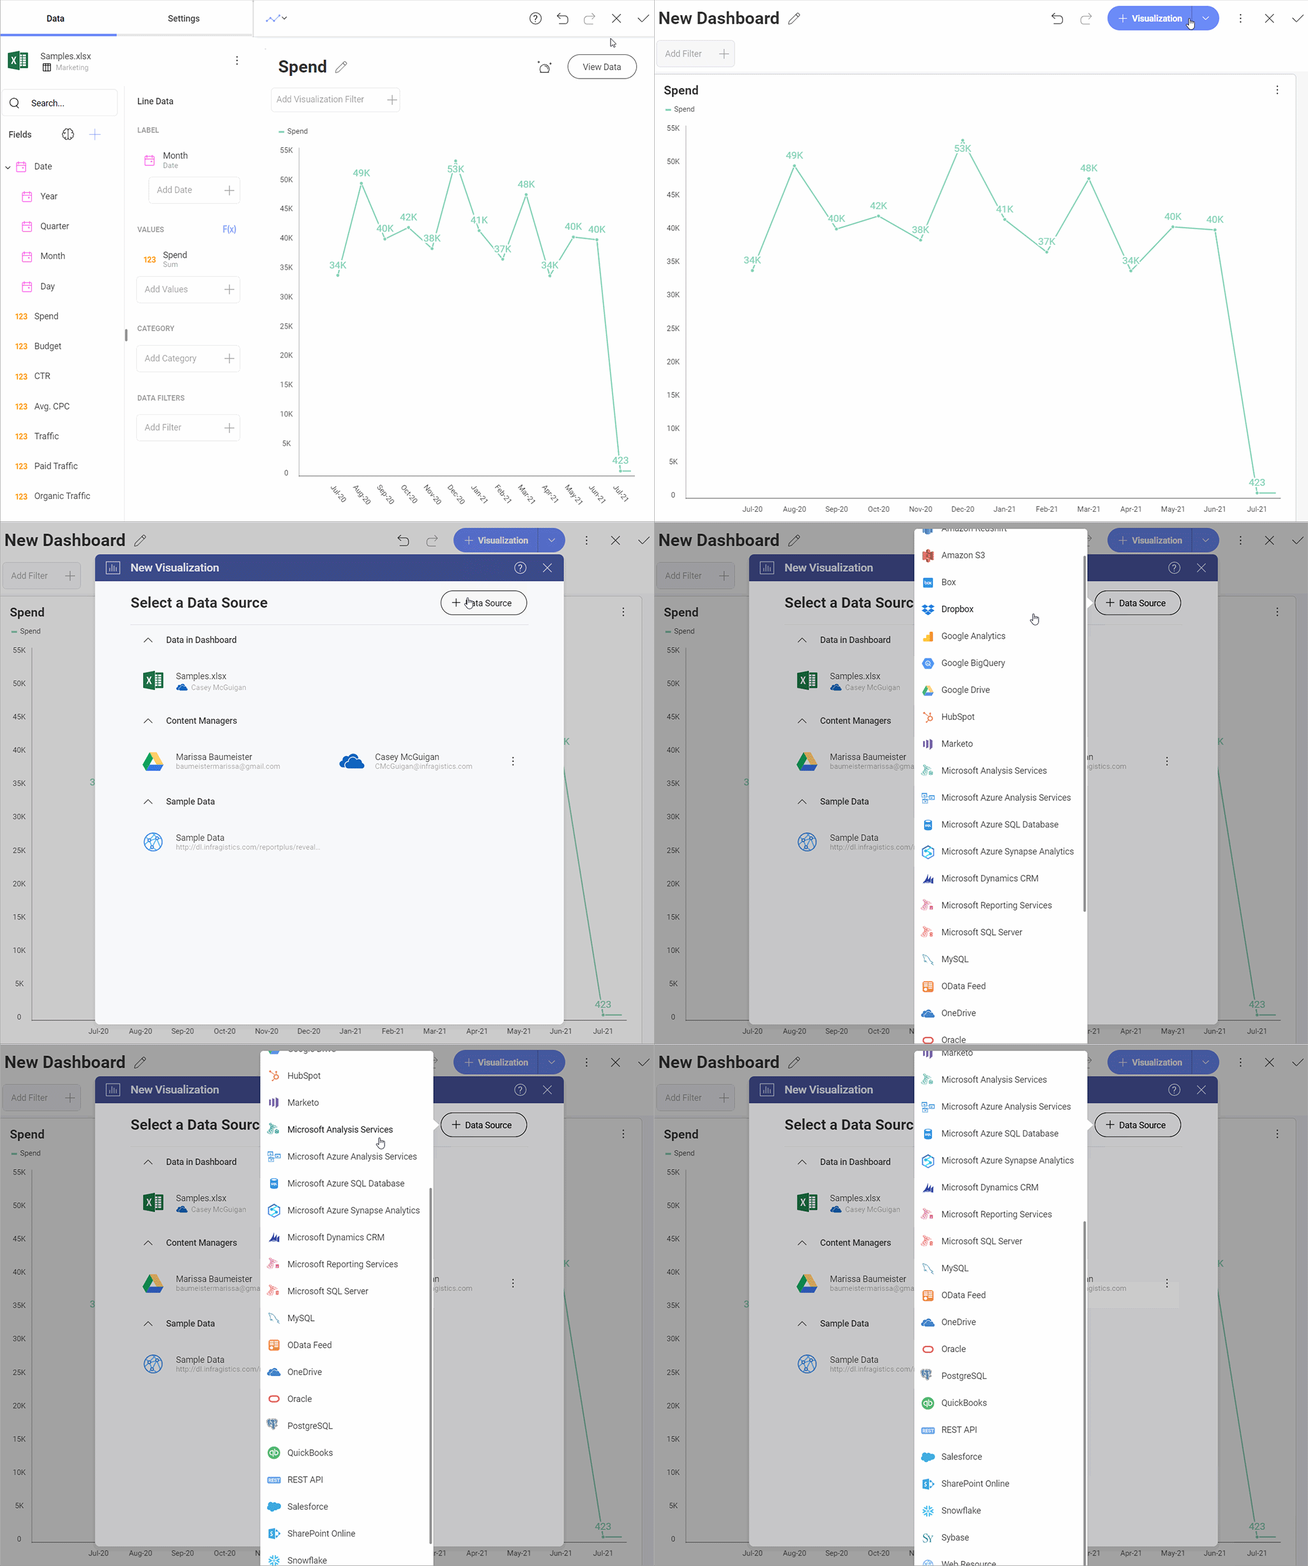
2.You are next prompted to select your data source. For a Google Sheet or Excel file, we will want to select the cloud provider where that file lives. Depending on what login you used (Google or Microsoft) you will have that respective provider already add.
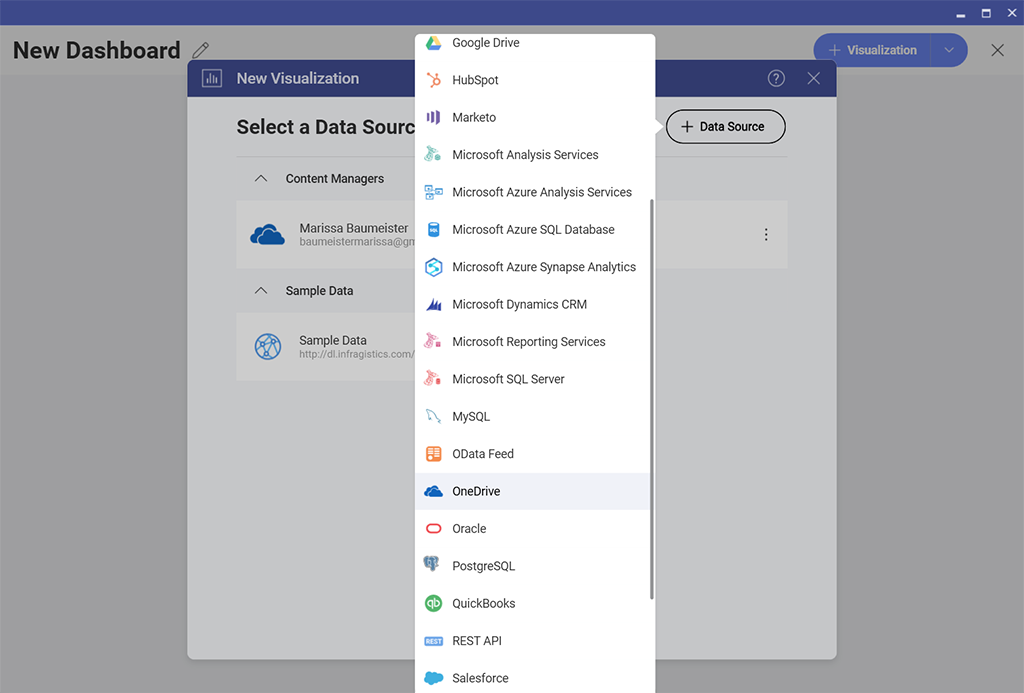
If you wish to choose a different one, you will need to go to the + Data Source button and select which provider to use then follow the steps to log in.
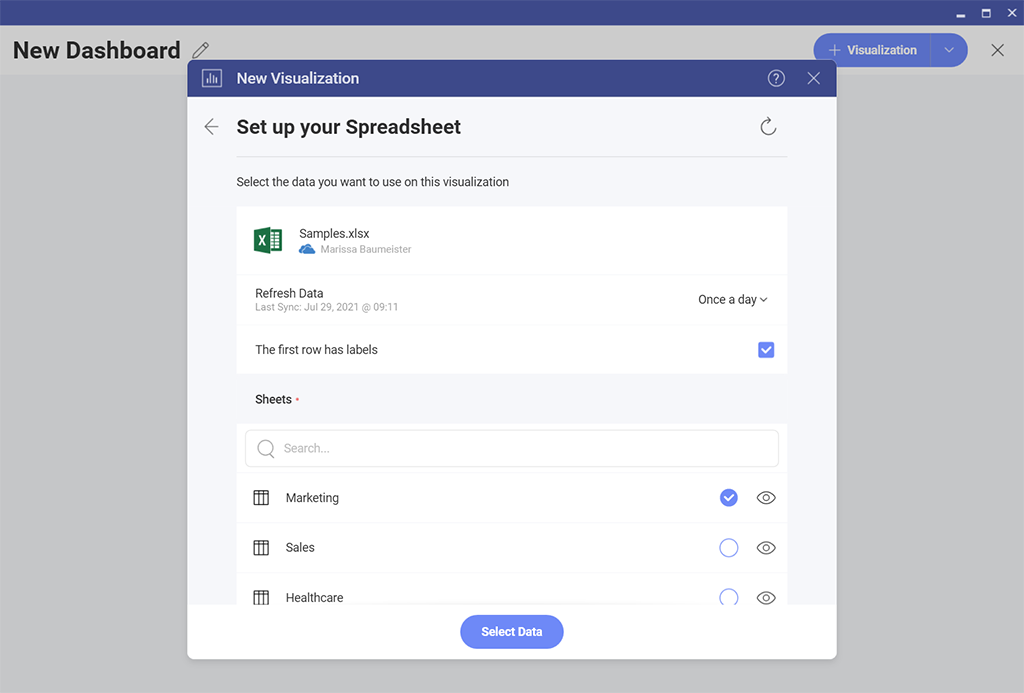
3.Once you locate the file you want to use, you will be able to select which sheet you want to use for your visualization.
4.After you click select data, you will be brought into the visualization editor where you can begin to drag over the fields you wish to use, change your chart types, and much more.
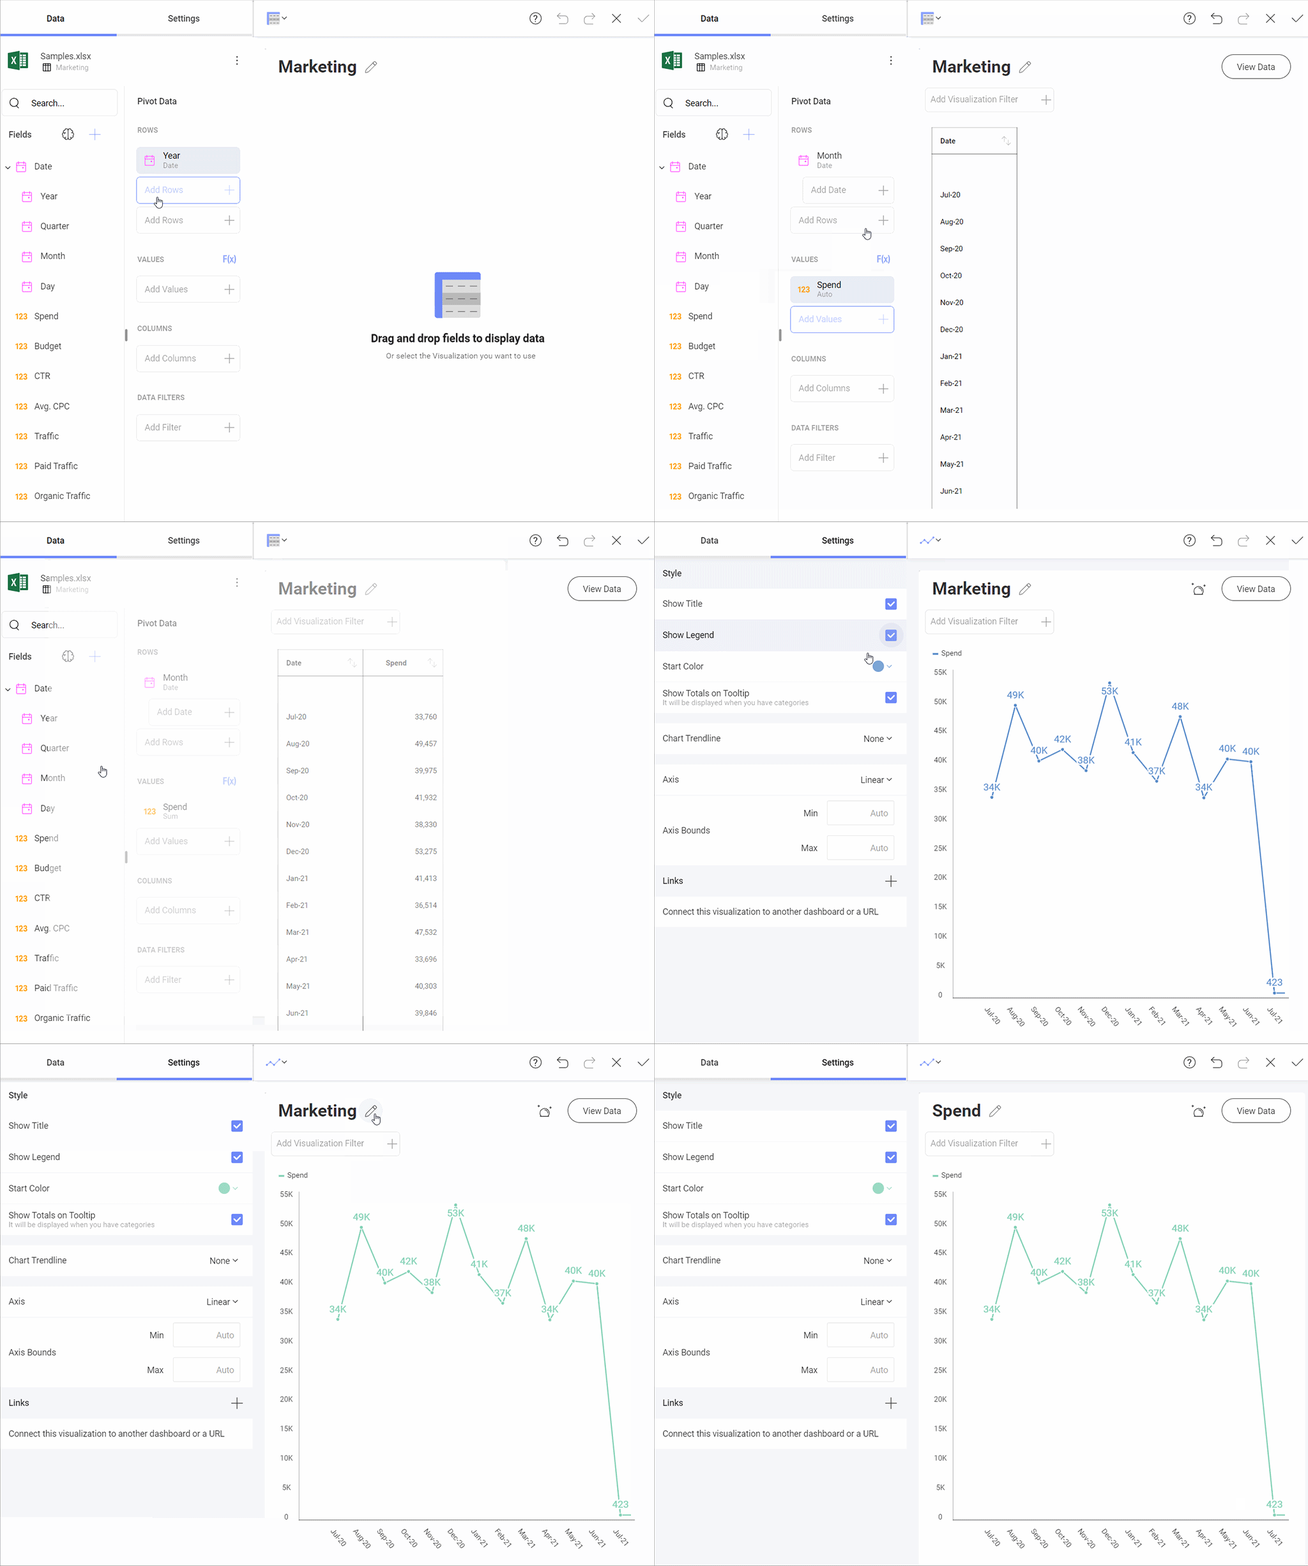
5.Once happy with your visualization, you can hit the check-in the top corner and return out to the dashboard. From here you can continue to add more visualizations from the same data source or even add new ones.
As you know, Slingshot is the only digital workplace that you need in order to run high-performing teams. By bringing together data, project management, content, and collaboration all into one application the sky is your limit.
The means that all these features work seamlessly together in what we refer to as productivity flows inside Slingshot.
When it comes to Excel and Google Sheets from their overflow icons you can:
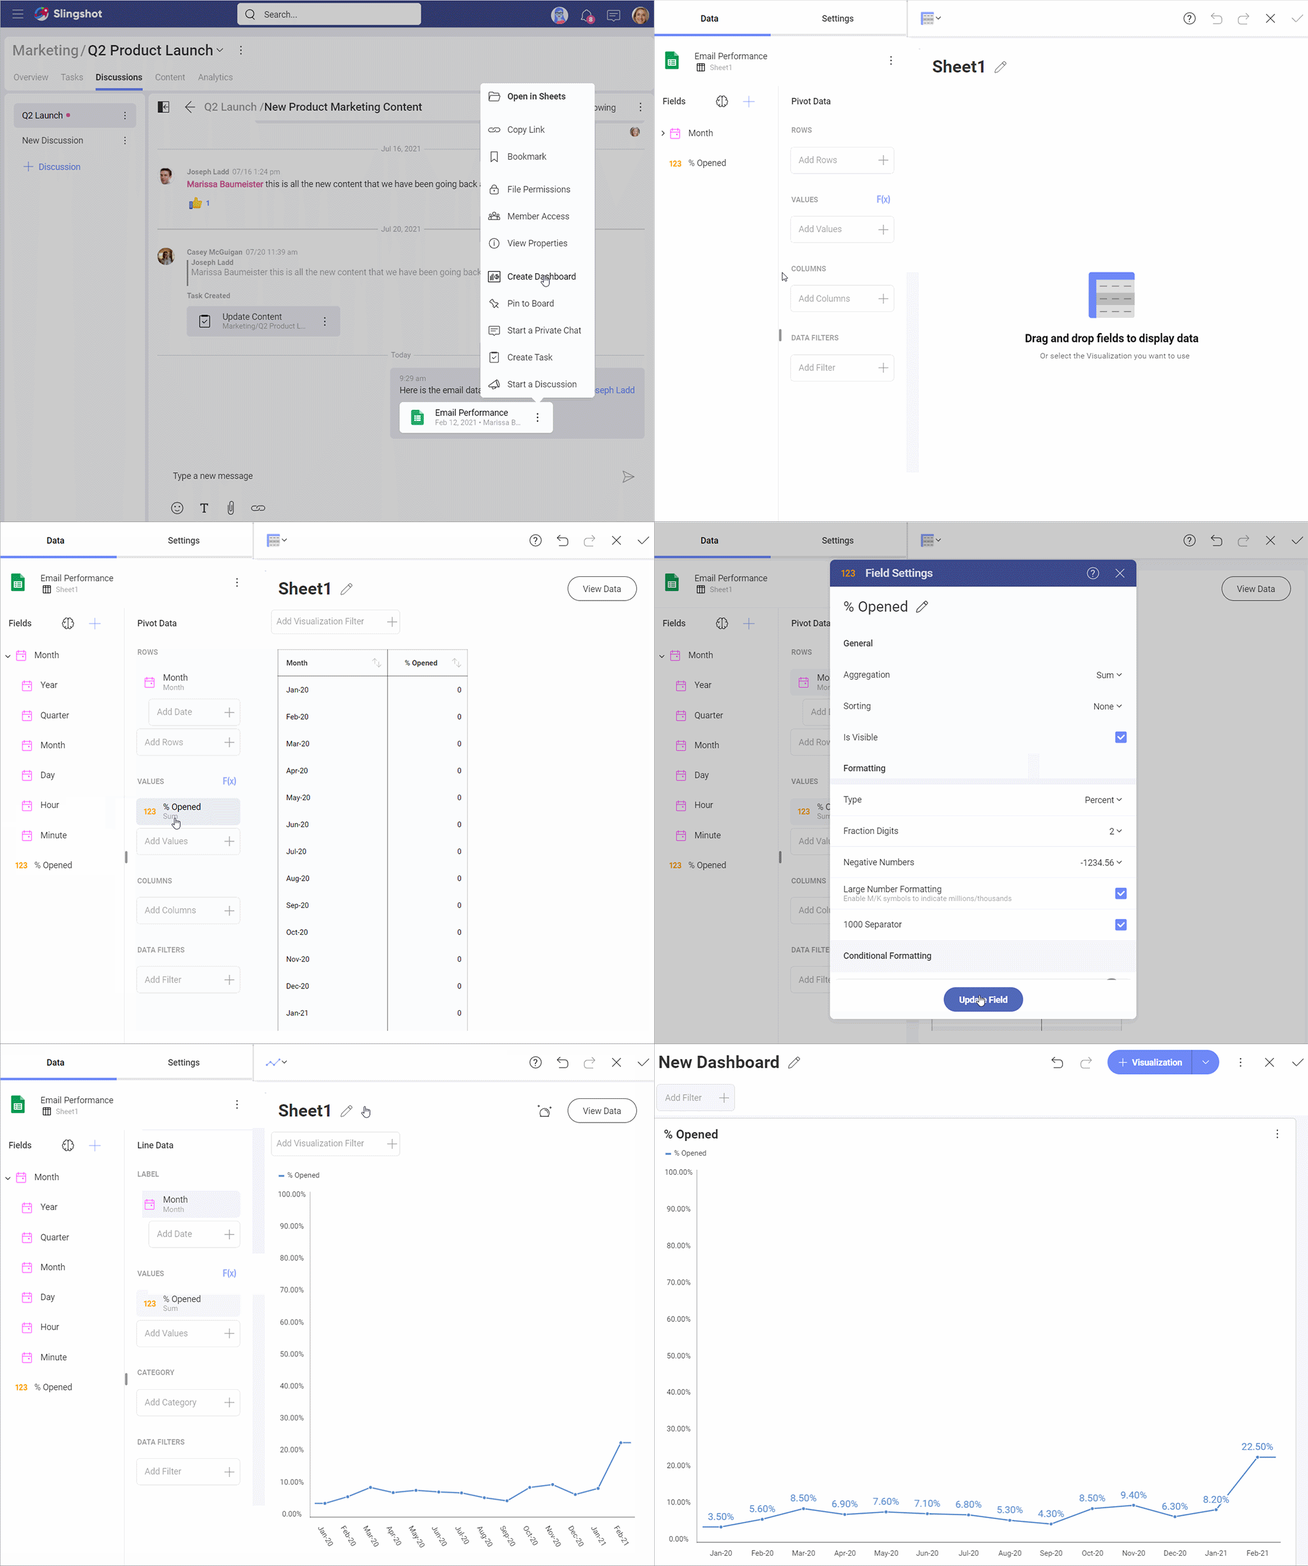
This saves a tremendous amount of time when you think about all the app switching that needs to happen to achieve the above in current tools that specialize in one of these areas.
Interested to see it in action? Try Slingshot for free and see how it can help you leverage Excel and Google Sheets in the context of your workflow.