
How Stephen Gould Scaled Its Capacity by 30% without Making a Single Hire
The Slingshot Blog
Get the latest trends in project management, team collaboration, data visualization and more. Here we share our knowledge, best advice, how-tos, research, insights, and more - all with the aim of helping you boost team results.
Slingshot makes it easy to work with your Excel and Google Sheet files in many different ways.

In this article, we review the key differences between Slingshot and Asana to help you make up your mind and choose the perfect solution for your team.
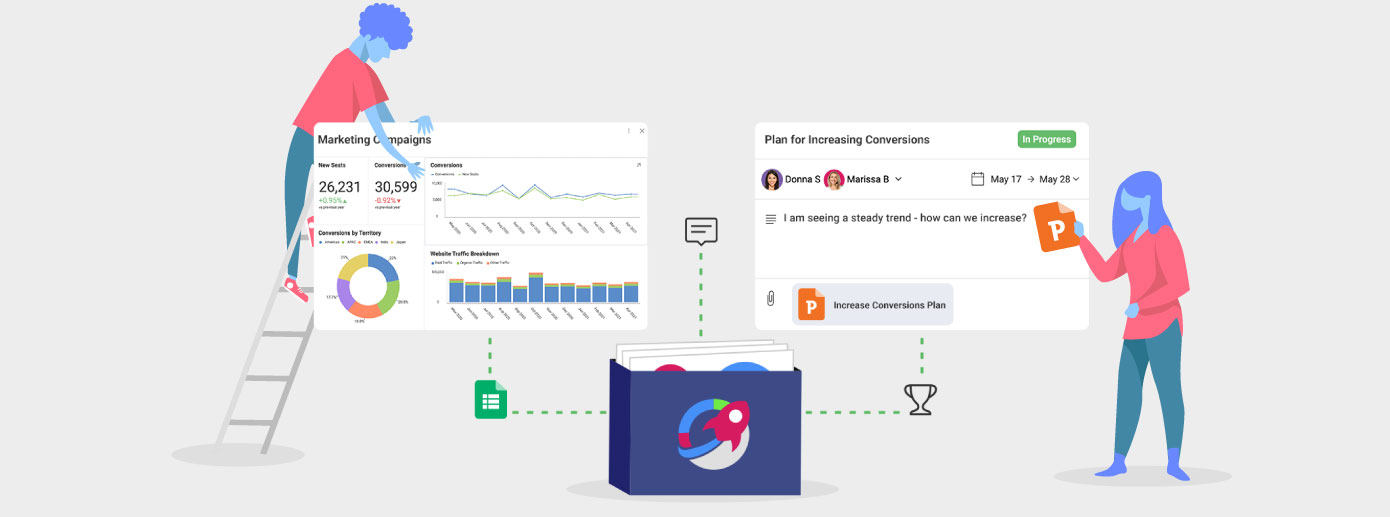
Collaboration software helps in reducing the stress of working with others no matter where they are located. It can help strengthen team relationships, save time and headaches, improve organization, and increases speed and efficiency.
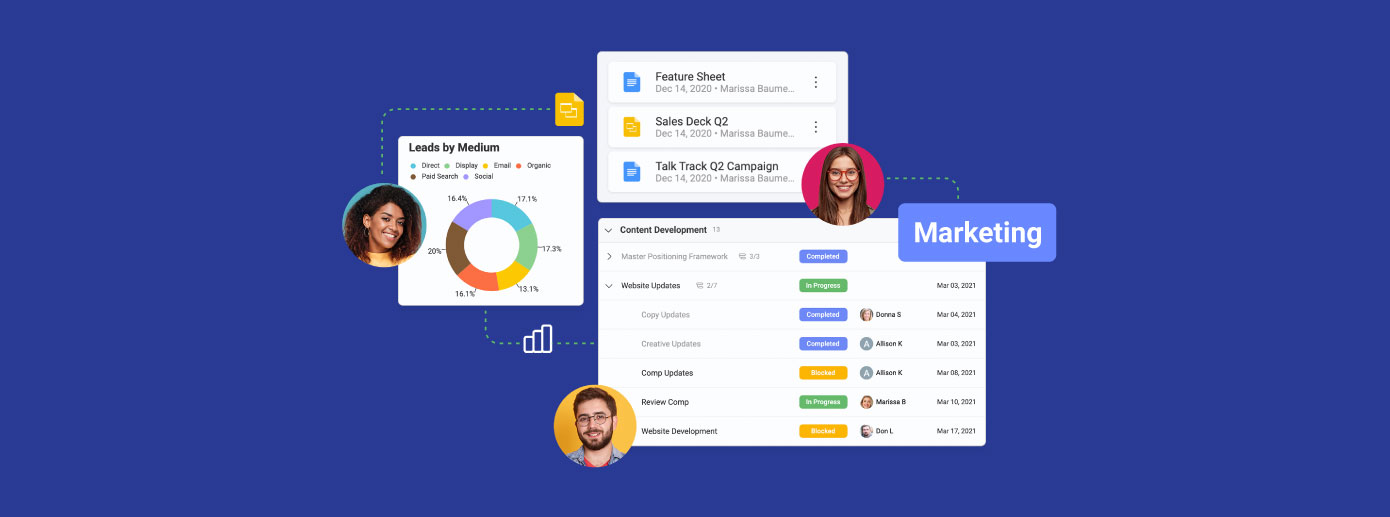
To maximize your chances of success, we’ve gathered all the necessary pieces that you need to assemble to build a marketing campaign that’s working from start to finish.
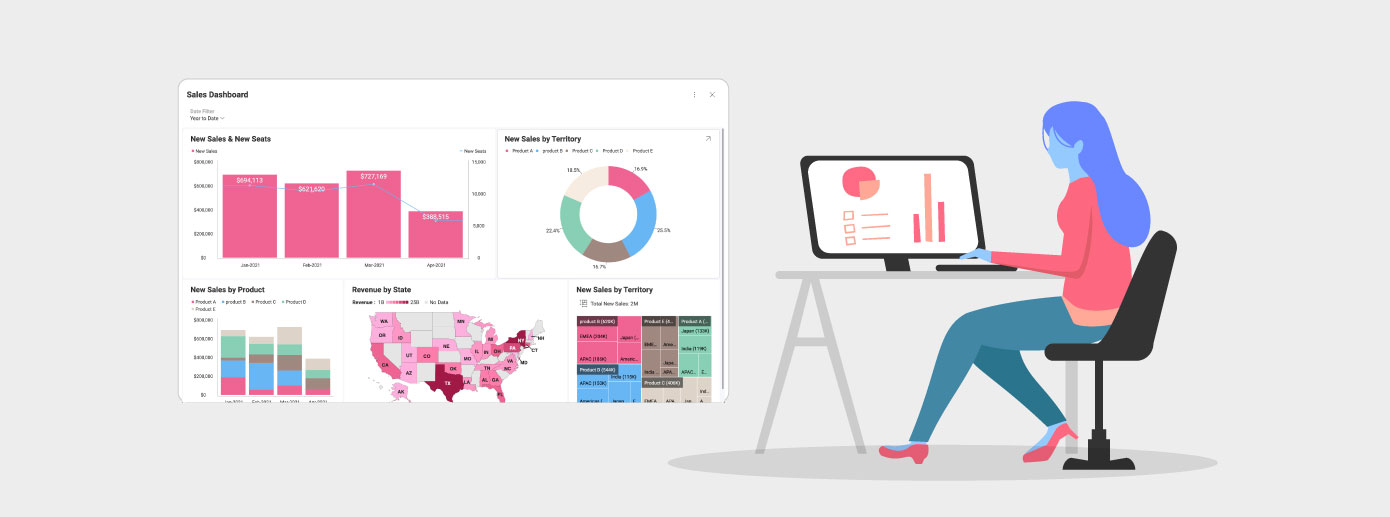
With a full business intelligence engine inside Slingshot, you can quickly connect to your different data sources and create dashboards within minutes.

In this article, we’ve gathered the top 35 marketing KPIs that everyone should track in order to understand and analyze the results of their marketing campaigns.
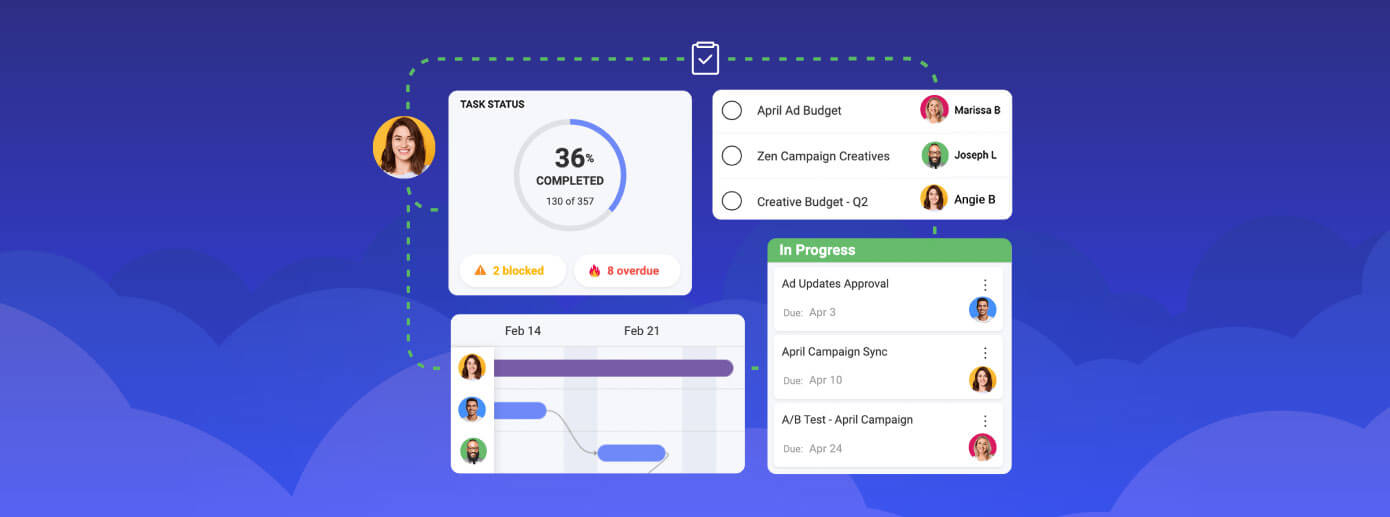
To help you choose the right project management software solution for your team and needs, we gathered this list of project management features that your project management software must have to deliver productivity, satisfaction, and peace of mind.
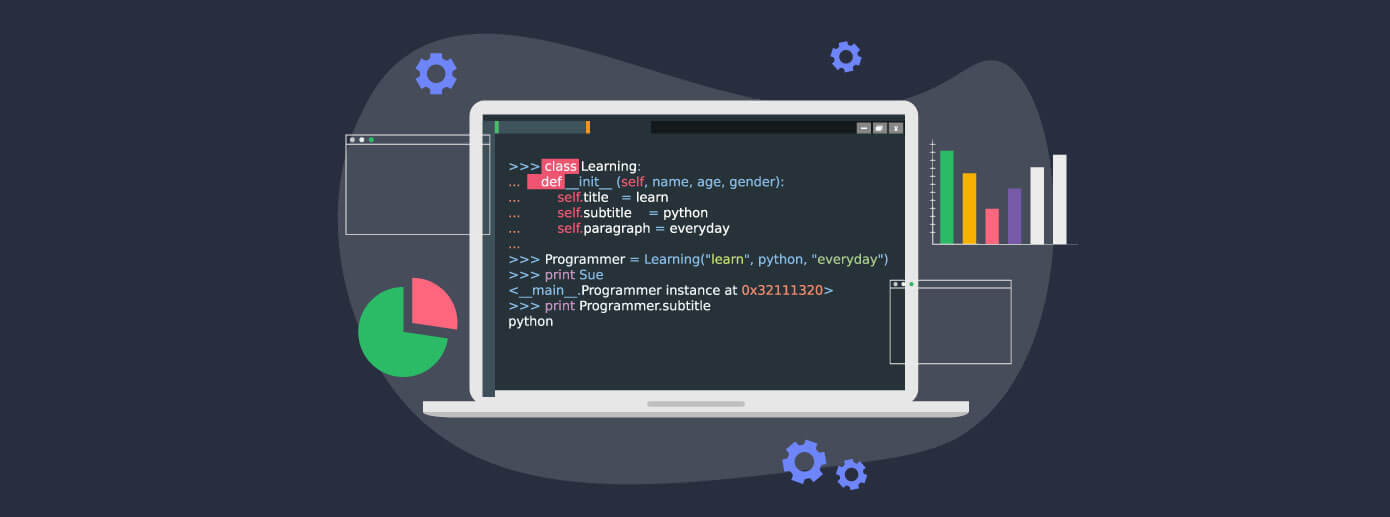
Using Python to create your data visualizations will help your users gain data insights in milliseconds compared to seconds or even minutes trying to analyze and understand large data sets of unformatted data represented in tabular formats
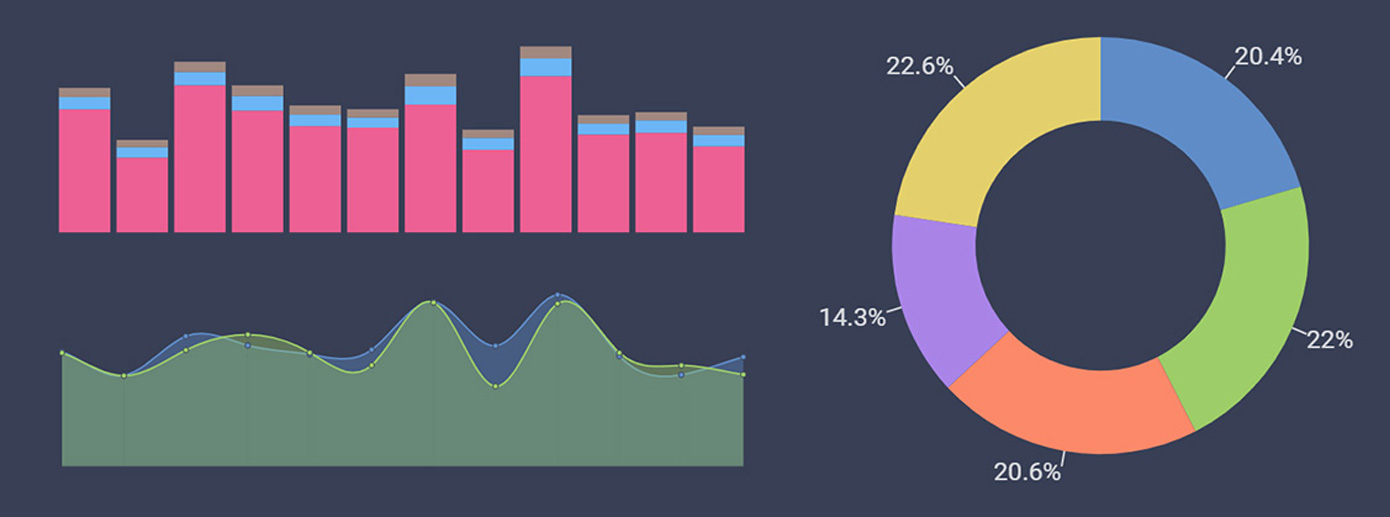
In this article, we make sure we show you the right steps to choose the best chart for your data, so your insights can always be used in the best way to get results.

When self-service BI is implemented in your digital workplace management software, everyone within your team can effortlessly create tasks from data and smoothly collaborate around it.