
How Stephen Gould Scaled Its Capacity by 30% without Making a Single Hire

To help you understand the power of data analysis and how you can use it to enhance your business practices, in this article, we are answering the most burning data analysis questions.
In today’s data-rich world, understanding how to analyze and extract the value of your business’s insights is one of the leading drivers of success.
A widely-quoted figure from a Forrester Research paper says that, on average, companies analyze only 12% of their available data. You guessed it, that means that the other 88% of their data go to waste. Reasons for this include a lack of analytics tools, repressive data silos, and users not knowing which data is valuable and which could be ignored.
With so much data and so little time to act on it, the ability to know how to effectively collect, curate, organize and understand your business data can be tough, but data analysis is a great solution.
To help you understand the power of data analysis and how you can use it to enhance your business practices, we are answering the most burning data analysis questions:
Data analysis is defined as a process of cleaning, analyzing, interpreting, and visualizing data to reveal useful insights to guide your business decision-making process.
Along with data analysis, you’ll often hear the term data analytics. The difference between both is that data analytics is an overarching science that encompasses the entire process of data management, including the data analysis itself, a variety of tools and techniques used to deep-dive into data, as well as data visualization tools used to communicate the results of the data analysis.
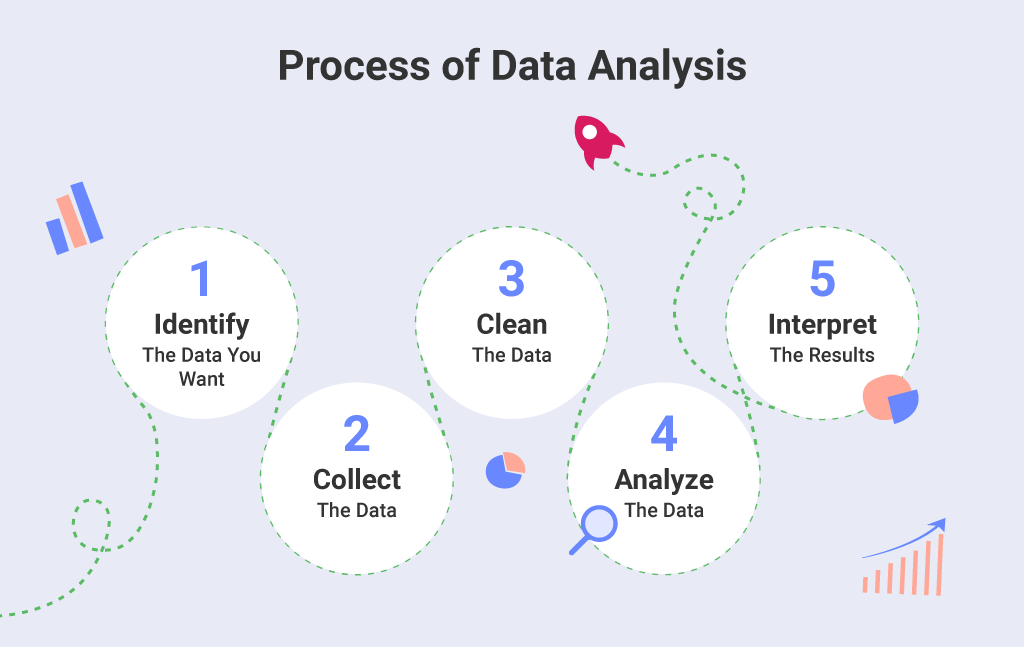
The most straightforward answer to the question of what data analysis does is that it helps extract insights from data to guide better and smarter business decisions. There are several types of data analysis depending on the question you’re trying to answer, but the process of analyzing data typically moves through five key phrases:
By doing data analysis, whether it is for market positioning, understanding customer needs, or improving your marketing campaigns performance, you provide your organization with the insights needed in order to make the best decisions possible and act at the right moment, making the most out of any opportunity.
Technology is quickly changing the way businesses operate, and that is why data analysis is more important now than ever before. Being data-driven and making data-driven decisions is the only way to be completely confident when making choices about the future of your business.
Data analysis can help businesses:
As you can see, data analysis provides organizations with plenty of benefits. Ultimately, analysis and usage of data in the right way leads to more satisfied customers, new users, higher revenue, and a successful strategy. And these are all part of the reason why we believe that data-driven decision-making is the roadmap to success and one of the top things businesses should focus on moving forward. It completely eliminates gut feelings as a factor and focuses solely on facts.
These are the 4 main types of data analysis:
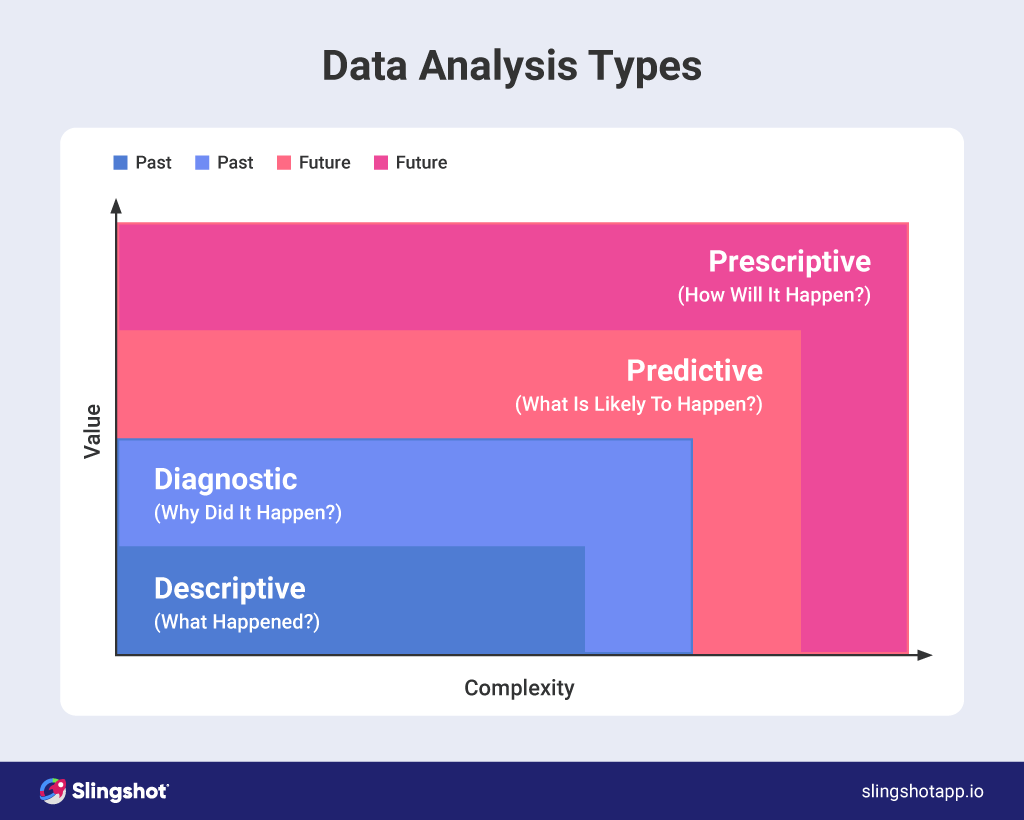
The purpose of the descriptive type of data analysis is to answer the question of what happened. It doesn’t try to explain why this might have happened or what would happen afterward, it’s simply aimed at providing an easily digestible snapshot of what has happened in the past. It does this by ordering, manipulating, and interpreting raw data from various data sources to transform it into useful insights for your business.
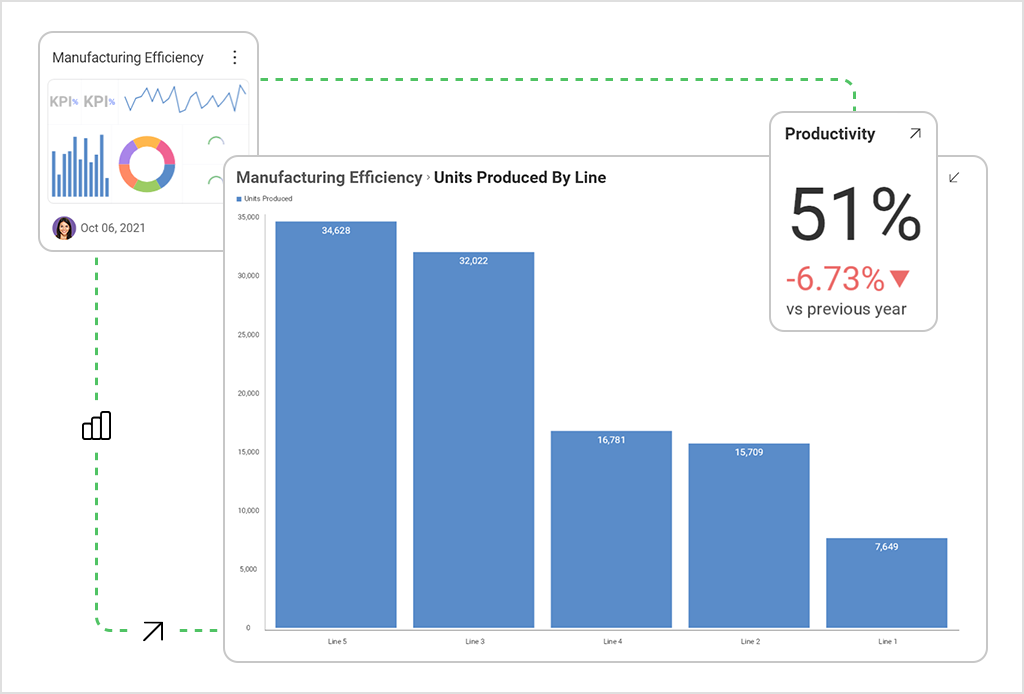
Data aggregation and data mining are the two main techniques used in descriptive analysis. Data aggregation is the process of gathering data and presenting it in a summarized format, whereas data mining is the analysis part. In the analysis part, analysts can explore the data gathered to uncover any patterns or trends. The outcome is a visual representation of data in the form of a graph, chart, or dashboard.
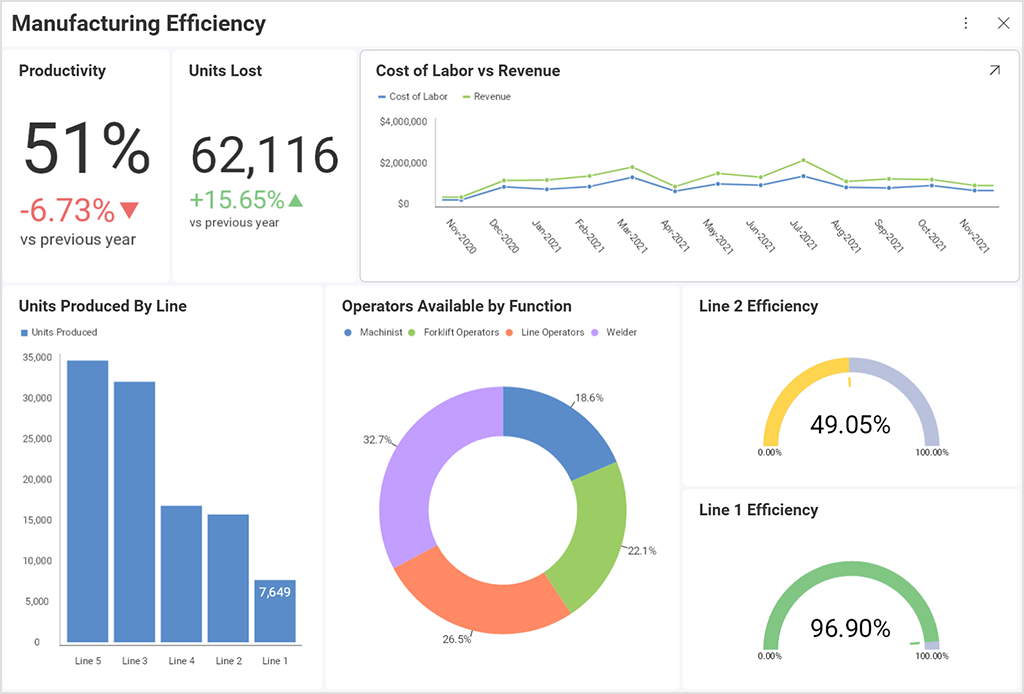
One of the biggest uses of descriptive analysis in business is to track KPIs (key performance indicators) to describe how a business is performing on all levels. It can be used to track your marketing KPIs or CEO KPIs, everything that you need and should be keeping a close eye on.
Performing descriptive analysis is the first step of analyzing your data and getting the most out of it. While it won’t allow you to predict future outcomes or tell you the answer to questions such as why something happened, it organizes your data and prepares it for further analysis.
Diagnostic analysis is one of the most powerful types of data analysis. After you already know what happened, the next logical step is to find out why did it happen, and this is what diagnostic analysis does. In its essence, the diagnostic type of data analysis helps users gain a contextual understanding of why something has happened. When you’re aware of why something happened and how did it happen, you can easily find ways of tackling the issue.
For example, if your descriptive analysis shows that there was a 15% drop in your email marketing open rate for the month of September, you can find out why by performing a diagnostic analysis. And vice versa, if your descriptive analysis shows a 40% increase in website traffic compared to the previous month, you can perform a diagnostic analysis to find out what caused that positive increase and how you can eventually sustain that traffic for the future.
Diagnostic analysis is a form of advanced analytics, and it is characterized by techniques such as drill-down, data discovery, data mining, and correlations. Businesses perform this type of data analysis to understand the connections between data and identify patterns of behavior.
As the name suggests, the predictive analysis predicts what is likely to happen in the future. It does this by using the results of the descriptive and diagnostic analysis, along with ML (machine learning) & AI (artificial intelligence). Based on patterns and trends uncovered in the previous two analyses, the predictive analysis estimates the likelihood of future events and outcomes. This is especially useful for businesses as it enables them to plan ahead and make strategies based on facts.
Predictive analysis is used for a lot more than just forecasting. It also helps businesses in all kinds of industries to detect fraud and reduce the potential for risk, improve operations, develop better and more effective marketing strategies, improve customer service, reduce costs, etc.
An important thing to note about predictive analysis is that the reliability of predictions depends heavily on the predictive analytics techniques chosen, and the quality of data used. The predictive analysis involves analytics techniques such as regression, classification, outliers, time series analysis, and more. These techniques require large amounts of high-quality data and a deep understanding of statistics and programming languages like R and Python, thus making it harder for some businesses to implement because of the lack of workforce expertise needed.
Luckily, there are many analytic tools available to help your business leverage predictive analysis to develop an informed prediction of how things may unfold in the future.
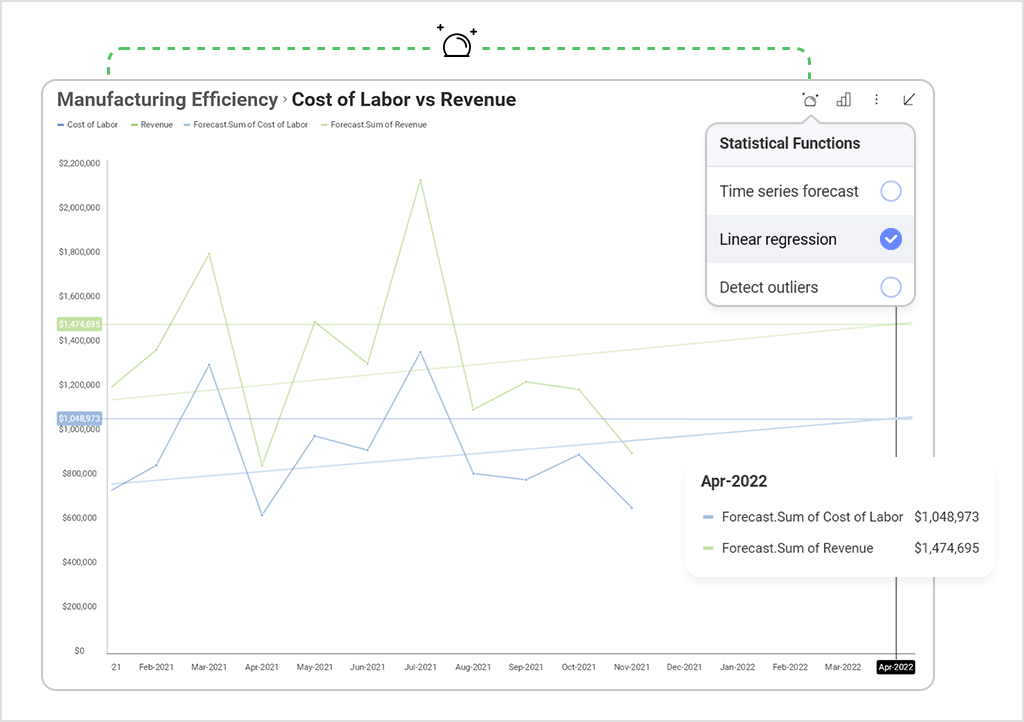
The final and most advanced level type of data analysis is prescriptive. The prescriptive analysis combines the insights from all previous analysis in order to determine what should be done next. It shows you how you can best take advantage of the future outcomes that have been predicted and answer the question of how you will make it happen.
The prescriptive analysis uses the full spectrum of complex data science techniques, including advanced analytics, and is the most difficult analysis to perform. The reliability of prescriptive analysis depends on how well you have performed the descriptive, diagnostic, and predictive analysis and their accuracy.
And as you can imagine, prescriptive analysis is the most important when it comes down to taking action. Each type of data analysis uncovers valuable and useful insights, but only when you use them all together can you understand the complete picture to ensure the best results. It is great to know what is likely to happen in the future, but if you don’t identify what you should do next to make the most out of this knowledge, then you won’t be able to achieve better results and grow your business.
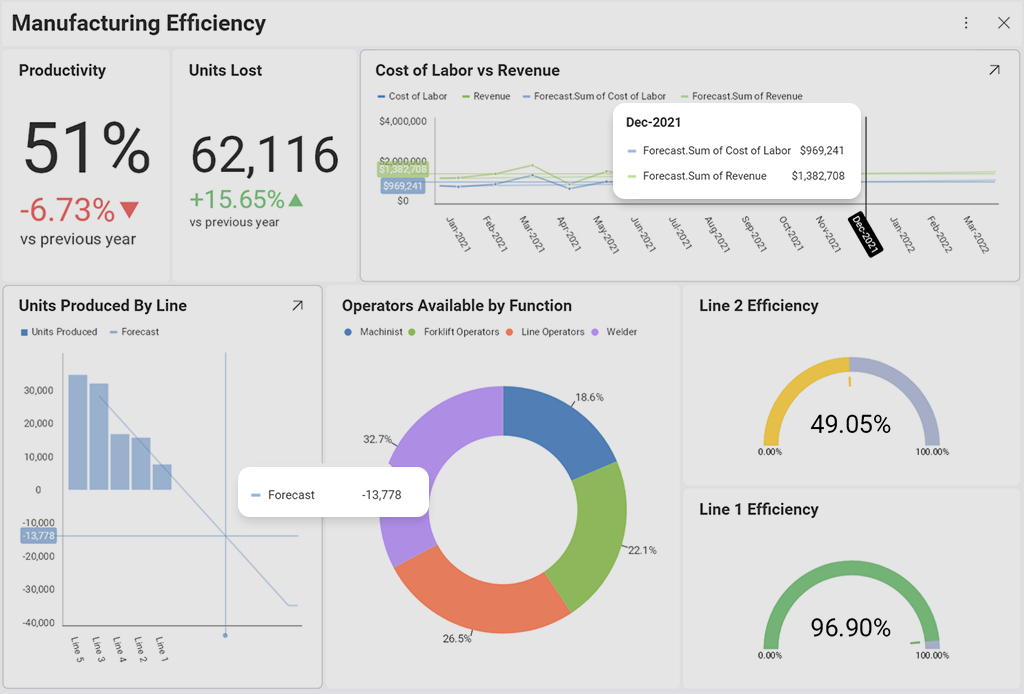
All kinds of businesses in every type of industry can harness the power of data analysis. These are some real-life examples of how 9 different industries are putting data to work:
Weather forecast – accumulates data about the current state of atmospheric conditions, particularly with temperature, humidity, and wind, and through the atmospheric process, data analysts determine what weather to expect.
Hotels – try to predict the number of guests for any given night to maximize occupancy and increase revenue.
Airlines – use predictive analytics to set ticket prices and determine aircraft maintenance requirements.
Marketing – marketing teams are using data analysis to run targeted marketing campaigns by segmenting audiences.
Finance – financial institutions can develop credit risk models, forecast financial market trends, and predict the impact of new policies, laws, and regulations on businesses and markets.
Manufacturing – use predictive analytics to monitor supplier performance, predict maintenance requirements and optimize production capacity.
Healthcare – hospitals, doctors, and other healthcare facilities can track the treatment of patients and determine patients who are at risk of developing diseases.
Security – protects businesses and individuals from hackers and cybercriminals.
Delivery – companies like DHL and FedEx are using data analysis to examine collected data and improve their overall efficiency.
Python is a general-purpose programming language that consists of high-level data structures, dynamic typic and dynamic binding, and a variety of other features that make it valuable for the development of complex applications, as well as for powerful data analysis. Thanks to this, Python has grown into the most used programming language for data science. It presents developers with a myriad of options to visualize data and gain insights.
Data visualization plays a significant role in the data analysis process and helps make data clearer and easier to understand by all types of users, including those that don’t have any analytical skills. The visual representation of data with Python data visualization tools can help you identify trends and patterns, and correlations that users typically never discover.
Another advantage of using Python for data analysis is that it offers numerous open source and commercial visualization libraries. Based on the type of data you have and want to analyze, you can choose between financial charts, scientific charts, business charts, and much more.
Python is a great data analysis tool, but data analysis isn’t its primary focus, whereas R is a language that is primarily used for data analysis.
R is a programming language and environment for statistical computing, graphical data analysis, and scientific research that lets developers and data scientists create various types of visualizations to represent complex, raw data with minimum coding. R was built to demonstrate the results of statistical analysis with the base graphics module allowing you to create charts and plots with ease.
Creating data visualizations in R is a technique of extracting data insights with the help of R’s diverse functionalities such as its strong graphical capabilities and wide selection of datasets. Just like Python, R also offers several visualization libraries including ggplot2 which allows users to build almost any type of chart and improves the quality and aesthetics of any graphic.
Data analysis tools simplify the way users process and analyze data, explore the relationships and correlations between data sets, and identify patterns and trends for interpretation.
Slingshot is simultaneously a business intelligence tool that provides you with dashboards and analytics, a chat platform for easy collaboration, a project management software, and a planning tool for the team, helping with ownership, division of tasks, and keeping track of progress and/or issues. Connecting to the data in a meaningful way leading to actions has never been easier. And that is, ultimately, what data-driven culture is all about – putting facts at the forefront in an intelligent way, with analysis, creativity, and drive for success.
With Slingshot, you can easily analyze data and create beautiful data visualizations to unlock your business data’s full potential. Interested in learning more? Try Slingshot for free and see for yourself how it can help you leverage actionable insights all while making it easier for your team to utilize data, cultivate a data-driven culture and improve productivity.